Quick Summary:

EQSA is an interactive tool for earthquake situational analytics using social media, designed to characterize conditions around earthquake zones by analyzing event-related messages, resource allocation, and community responses. It provides comprehensive insights through intuitive visualizations and linked views of social media data.

Summary

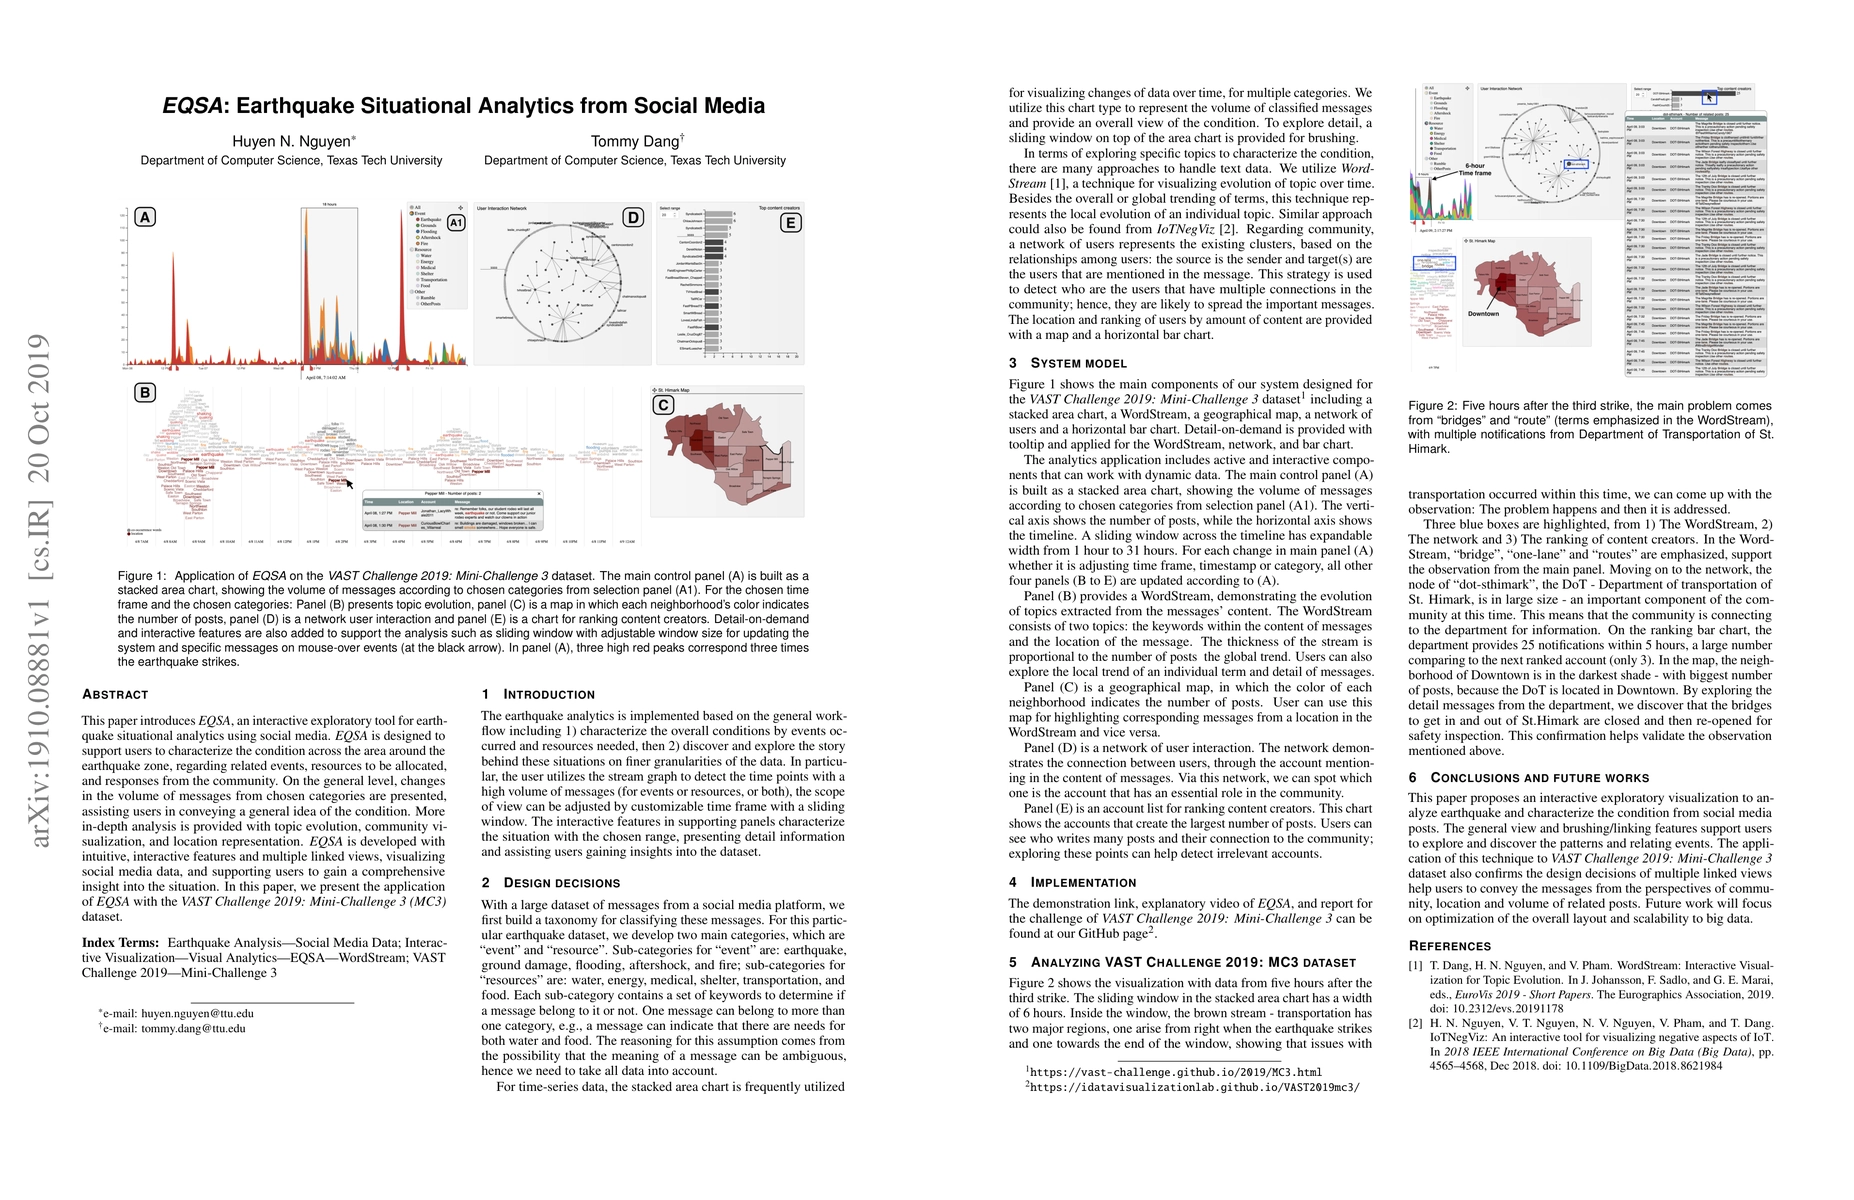
This paper introduces EQSA, an interactive exploratory tool for earthquake situational analytics using social media. EQSA is designed to support users to characterize the condition across the area around the earthquake zone, regarding related events, resources to be allocated, and responses from the community. On the general level, changes in the volume of messages from chosen categories are presented, assisting users in conveying a general idea of the condition. More in-depth analysis is provided with topic evolution, community visualization, and location representation. EQSA is developed with intuitive, interactive features and multiple linked views, visualizing social media data, and supporting users to gain a comprehensive insight into the situation. In this paper, we present the application of EQSA with the VAST Challenge 2019: Mini-Challenge 3 (MC3) dataset.

Paper Details

PDF Preview

Download PDF

Key Terms

interactive (0.263)
social media (0.258)
interactive (0.252)
users (0.247)
users (0.234)
media (0.231)
media (0.214)
community (0.212)
community (0.210)
social (0.209)
social (0.203)
challenge (0.189)
challenge (0.180)
condition (0.177)
condition (0.164)
messages (0.154)
views (0.152)
views (0.152)
messages (0.150)
vast (0.150)

Citation Network

Current paper (gray), citations (green), references (blue)

Current Paper
Citations
References
Click to view
Title Authors Year Actions
Social Media Analytics in Disaster Response: A Comprehensive Review
Mohammadsepehr Karimiziarani
2023
View Paper
Modie Viewer: Protein Beasts and How to View Them
Huyen N. Nguyen, Caleb M. Trujillo, Tommy Dang
2022
View Paper
WordStream Maker: A Lightweight End-to-end Visualization Platform for Qualitative Time-series Data
Huyen N. Nguyen, Tommy Dang, Kathleen A. Bowe
2022
View Paper
PMUVis : A Large-Scale Platform to Assist Power System Operators in a Smart Grid
Anjana Arunkumar, N. Gupta, Andrea Pinceti, L. Sankar, Chris Bryan
2022
View Paper
RAMPVIS: Answering the challenges of building visualisation capabilities for large-scale emergency responses
M. Chen, A. Abdul-Rahman, D. Archambault, J. Dykes, A. Slingsby, Panagiotis D. Ritsos, T. Torsney-Weir, C. Turkay, B. Bach, R. Borgo, A. Brett, H. Fang, R. Jianu, S. Khan, R., S. Laramee, P. H. Nguyen, R. Reeve, J. C. Roberts, F. Vidal, Q. Wang, J. Wood, K. Xu
2022
View Paper
Big data for human security: The case of COVID-19
Pedro Cárdenas, I. Ivrissimtzis, Boguslaw Obara, Ibad Kureshi, Georgios Theodoropoulos
2022
View Paper
VisMCA: A Visual Analytics System for Misclassification Correction and Analysis. VAST Challenge 2020, Mini-Challenge 2 Award: Honorable Mention for Detailed Analysis of Patterns of Misclassification
Huyen N. Nguyen, Jake Gonzalez, Jian Guo, Ngan V. T. Nguyen, Tommy Dang
2021
View Paper
Interactive Qualitative Data Visualization for Educational Assessment
Huyen N. Nguyen, Caleb M. Trujillo, Kevin Wee, Kathleen A. Bowe
2021
View Paper
RAMPVIS: Towards a New Methodology for Developing Visualisation Capabilities for Large-scale Emergency Responses
M. Chen, A. Abdul-Rahman, D. Archambault, J. Dykes, A. Slingsby, Panagiotis D. Ritsos, T. Torsney-Weir, C. Turkay, B. Bach, A. Brett, H. Fang, R. Jianu, S. Khan, R. Laramee, P. H. Nguyen, R. Reeve, J. C. Roberts, F. Vidal, Q. Wang, J. Wood, K. Xu
2020
View Paper
Interface Design for HCI Classroom: From Learners' Perspective
Huyen N. Nguyen, V. Nguyen, Tommy Dang
2020
View Paper
AgasedViz: visualizing groundwater availability of Ogallala Aquifer, USA
Tommy Dang, Vung V. Pham, Huyen N. Nguyen, Ngan V. T. Nguyen
2020
View Paper
HackerNets: Visualizing Media Conversations on Internet of Things, Big Data, and Cybersecurity
Hao Van, Huyen N. Nguyen, R. Hewett, Tommy Dang
2019
View Paper
MalView: Interactive Visual Analytics for Comprehending Malware Behavior
Huyen N. Nguyen, Faranak Abri, Vung V. Pham, Moitrayee Chatterjee, A. Namin, Tommy Dang
2022
View Paper
JobNet: 2D and 3D Visualization for Temporal and Structural Association in High-Performance Computing System
Ngan V. T. Nguyen, Huyen N. Nguyen, Jon R. Hass, Tommy Dang
2021
View Paper

Comments (0)

This website uses cookies to ensure you get the best experience. Learn more