Publication
Metrics
AI Quick Summary
Researchers develop a visualization method using ergodic partition theory to identify invariant structures in high-dimensional phase spaces, providing new insights into complex dynamical systems.
Paper Preview
Abstract
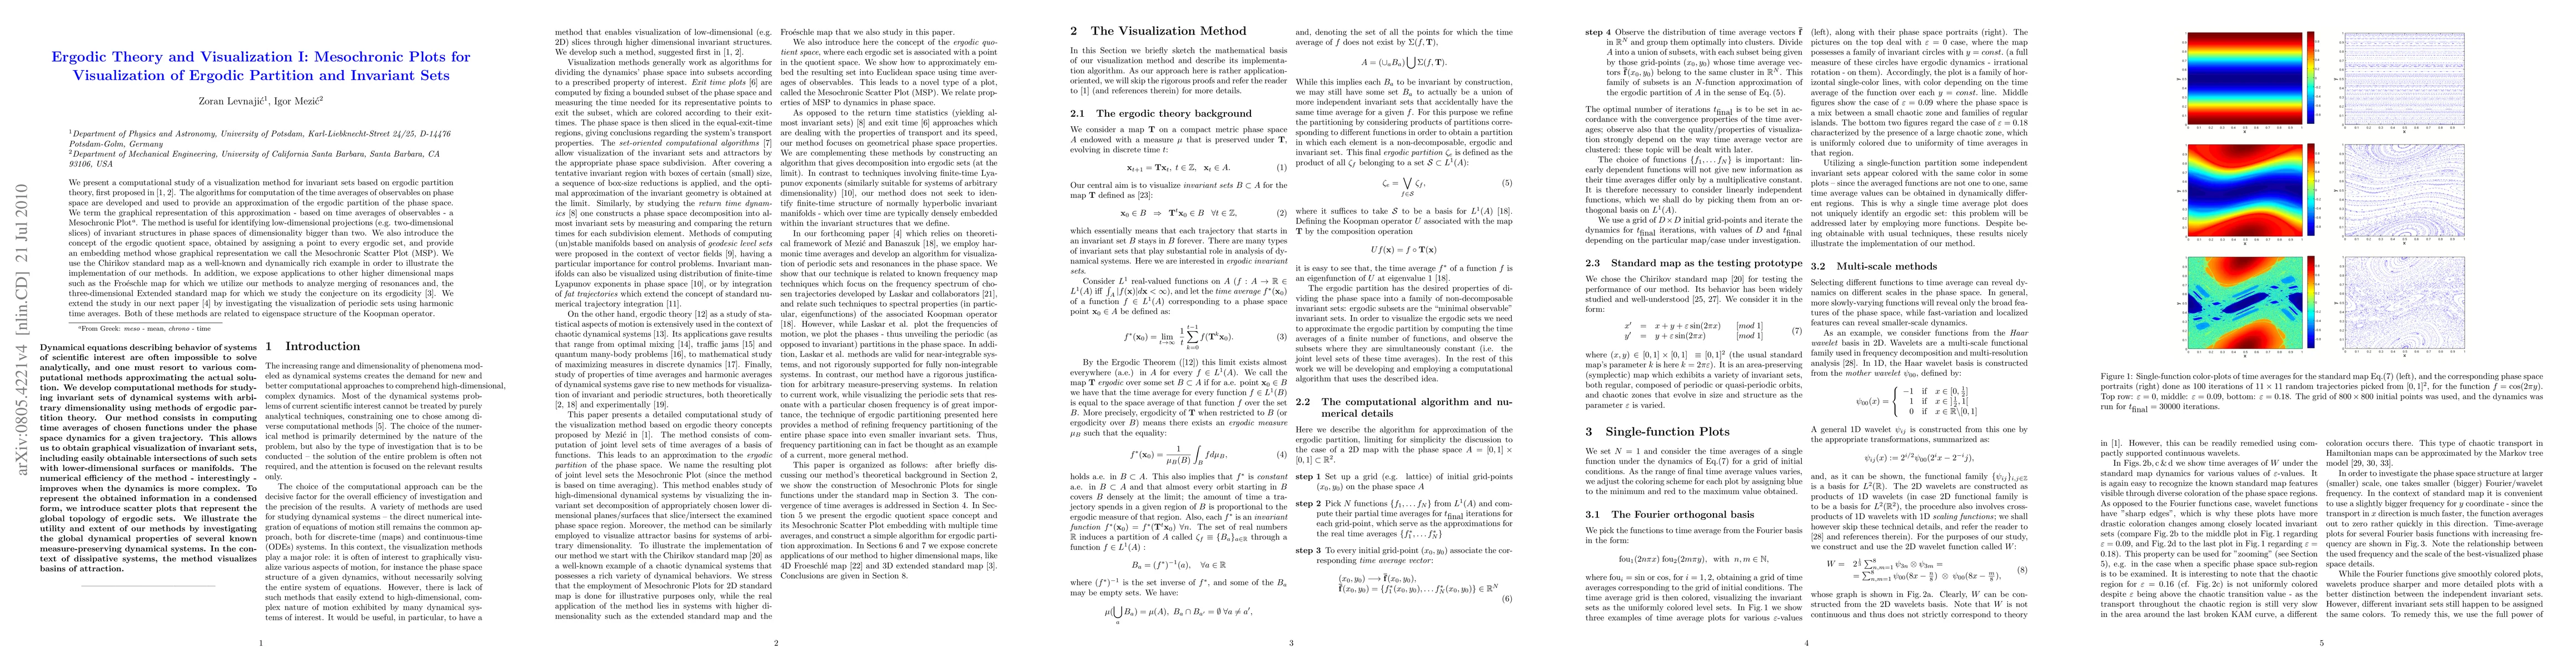
We present a computational study of a visualization method for invariant sets based on ergodic partition theory, first proposed in [1,2]. The algorithms for computation of the time averages of observables on phase space are developed and used to provide an approximation of the ergodic partition of the phase space. We term the graphical representation of this approximation - based on time averages of observables - a Mesochronic Plot (from Greek: \textit{meso} - mean, \textit{chronos} - time}. The method is useful for identifying low-dimensional projections (e.g. two-dimensional slices) of invariant structures in phase spaces of dimensionality bigger than two. We also introduce the concept of the ergodic quotient space, obtained by assigning a point to every ergodic set, and provide an embedding method whose graphical representation we call the Mesochronic Scatter Plot (MSP). We use the Chirikov standard map as a well-known and dynamically rich example in order to illustrate the implementation of our methods. In addition, we expose applications to other higher dimensional maps such as the Fro\'eschle map for which we utilize our methods to analyze merging of resonances and, the three-dimensional Extended standard map for which we study the conjecture on its ergodicity [3]. We extend the study in our next paper [4] by investigating the visualization of periodic sets using harmonic time averages. Both of these methods are related to eigenspace structure of the Koopman operator.
AI Key Findings
Get AI-generated insights about this paper's methodology, results, significance, and more — seven facets brought into focus.
Impact
Paper Details
PDF Preview
Key Terms
Citation Network
Current paper (gray), citations (green), references (blue)
Display is limited for performance on very large graphs.
Discussion 0