Error bounds for gradient density estimation computed from a finite sample set using the method of stationary phase
Publication
Metrics
AI Quick Summary
This paper establishes error bounds for gradient density estimation using the method of stationary phase, showing that the approximation error is $O(1/N)$ as the sample size $N$ increases. The proposed method is computationally efficient and does not require parameter selection, unlike traditional methods like histograms and Parzen windows.
Paper Preview
Abstract
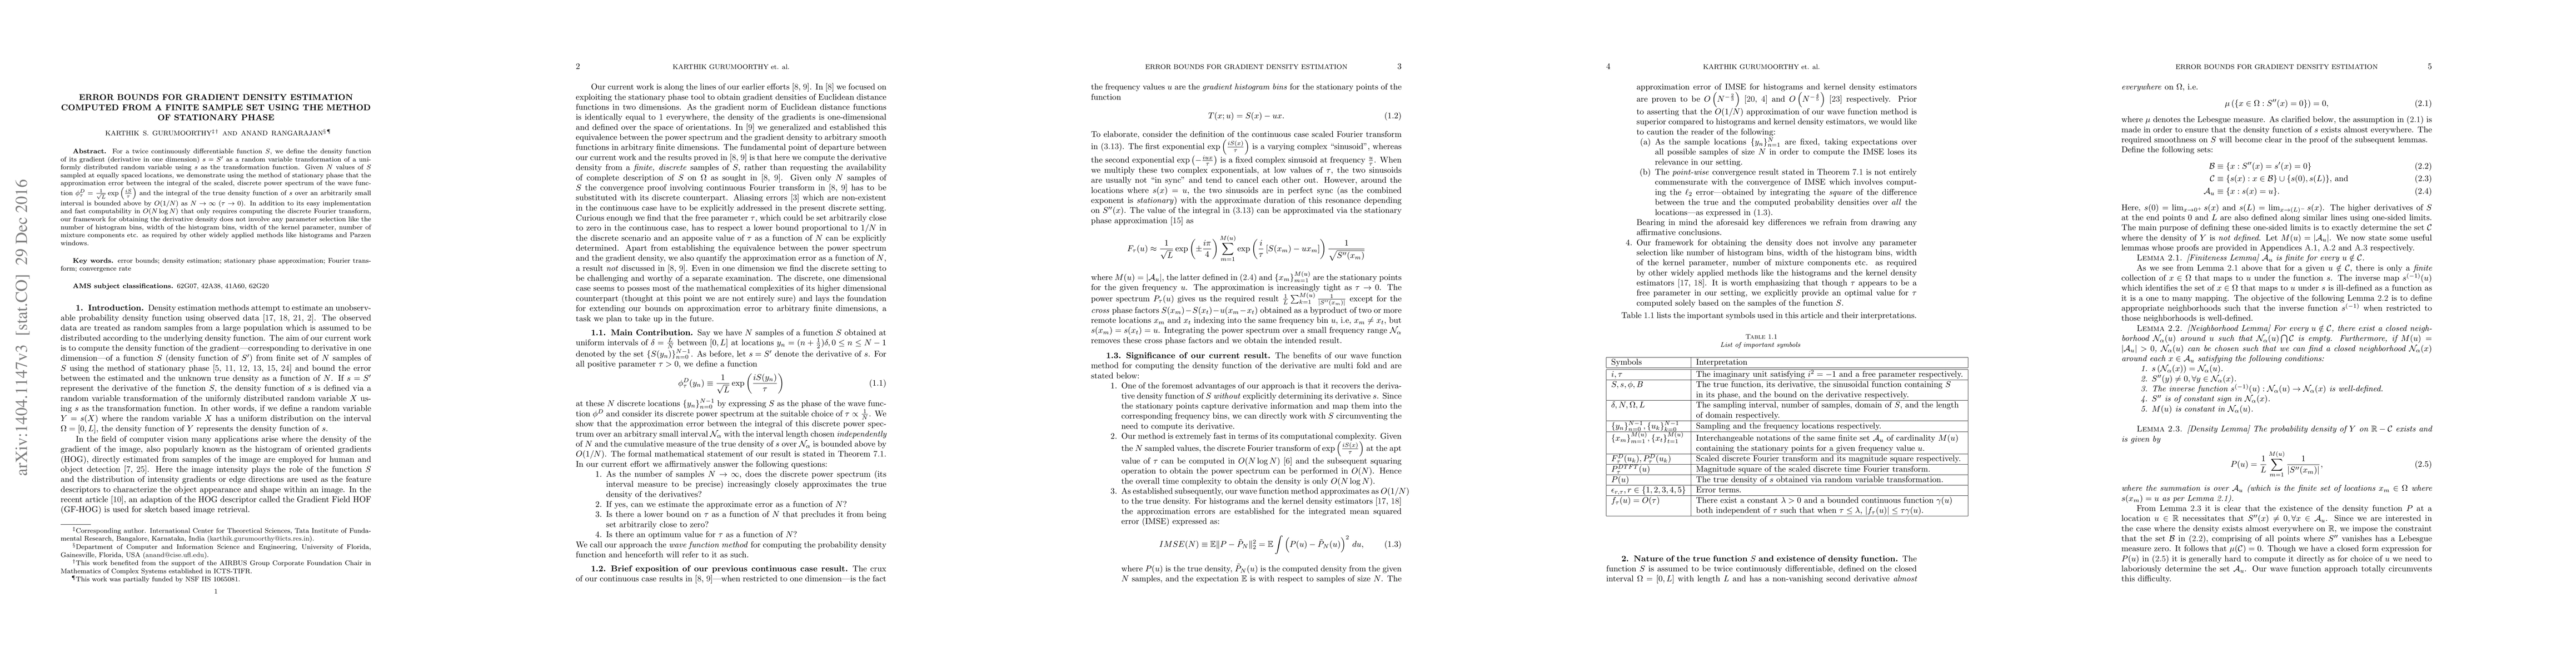
For a twice continuously differentiable function $S$, we define the density function of its gradient (derivative in one dimension) $s = S^{\prime}$ as a random variable transformation of a uniformly distributed random variable using $s$ as the transformation function. Given $N$ values of $S$ sampled at equally spaced locations, we demonstrate using the method of stationary phase that the approximation error between the integral of the scaled, discrete power spectrum of the wave function $\phi^{D}_{\tau}=\frac{1}{\sqrt{L}}\exp\left(\frac{iS}{\tau}\right)$ and the integral of the true density function of $s$ over an arbitrarily small interval is bounded above by $O(1/N)$ as $N \rightarrow \infty$ ($\tau \rightarrow 0$). In addition to its easy implementation and fast computability in $O(N \log N)$ that only requires computing the discrete Fourier transform, our framework for obtaining the derivative density does not involve any parameter selection like the number of histogram bins, width of the histogram bins, width of the kernel parameter, number of mixture components etc. as required by other widely applied methods like histograms and Parzen windows.
AI Key Findings
Get AI-generated insights about this paper's methodology, results, significance, and more — seven facets brought into focus.
Impact
Paper Details
PDF Preview
Key Terms
Citation Network
Current paper (gray), citations (green), references (blue)
Display is limited for performance on very large graphs.
Discussion 0