Summary
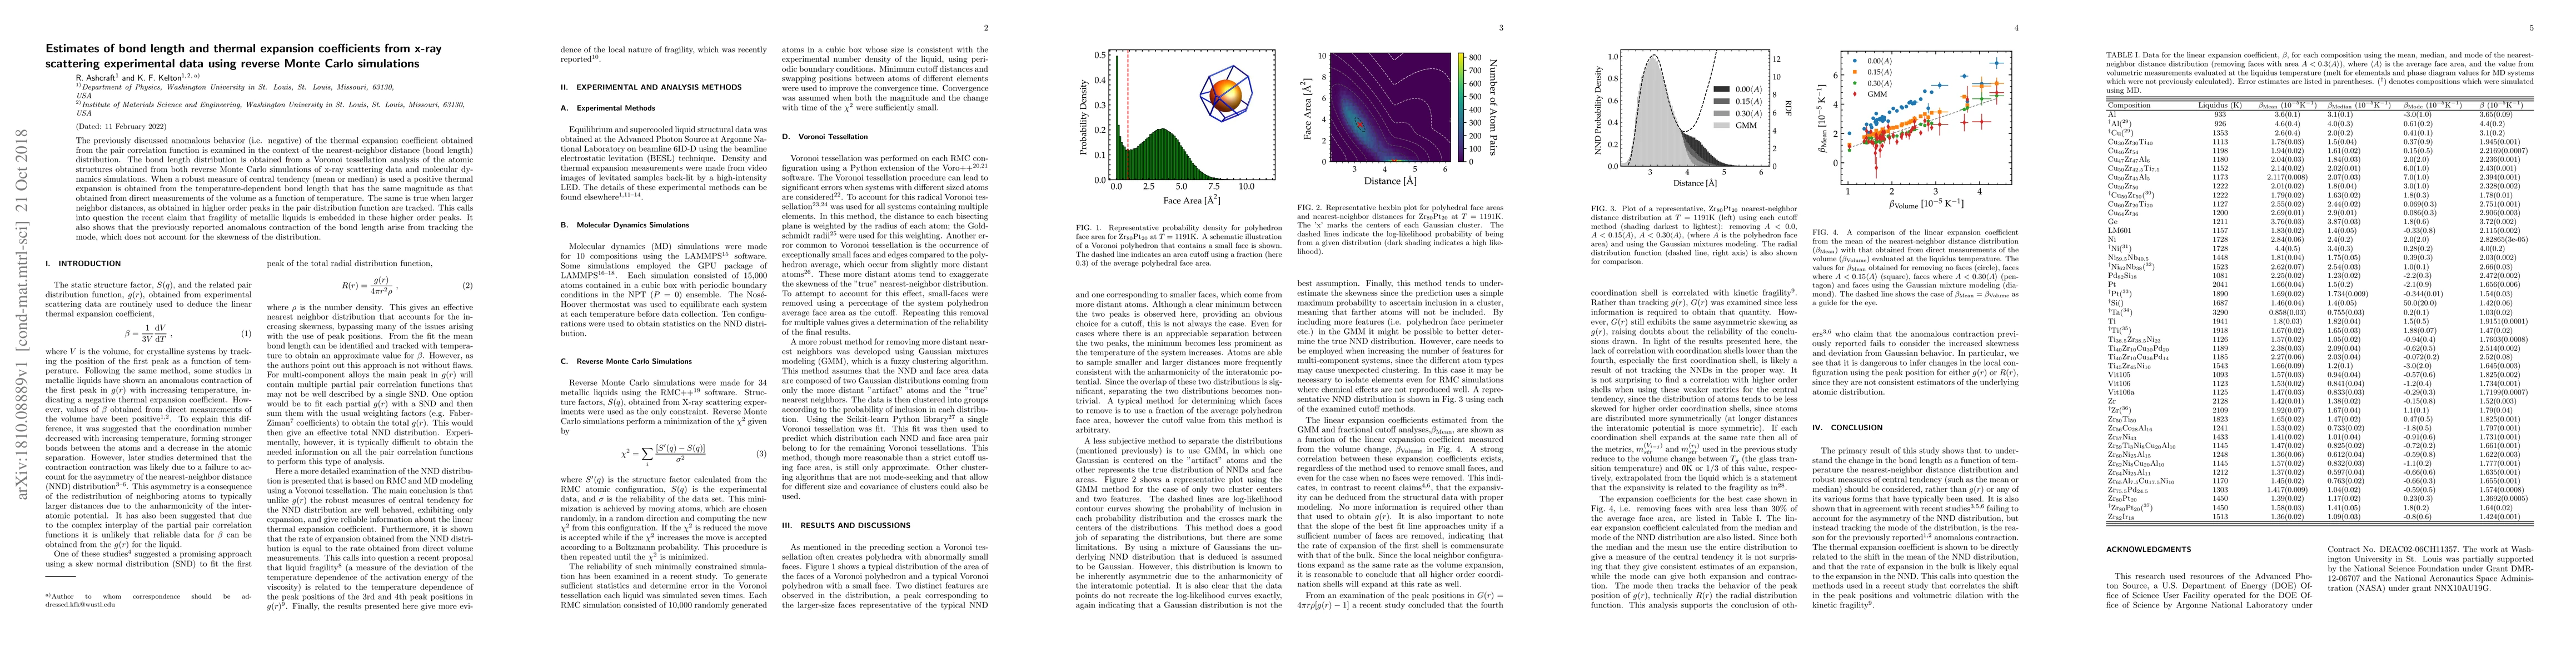
The previously discussed anomalous behavior (i.e. negative) of the thermal expansion coefficient obtained from the pair correlation function is examined in the context of the nearest-neighbor distance (bond length) distribution. The bond length distribution is obtained from a Voronoi tessellation analysis of the atomic structures obtained from both reverse Monte Carlo simulations of x-ray scattering data and molecular dynamics simulations. When a robust measure of central tendency (mean or median) is used a positive thermal expansion is obtained from the temperature-dependent bond length that has the same magnitude as that obtained from direct measurements of the volume as a function of temperature. The same is true when larger neighbor distances, as obtained in higher order peaks in the pair distribution function are tracked. This calls into question the recent claim that fragility of metallic liquids is embedded in these higher order peaks. It also shows that the previously reported anomalous contraction of the bond length arise from tracking the mode, which does not account for the skewness of the distribution.
AI Key Findings
Get AI-generated insights about this paper's methodology, results, and significance.
Paper Details
PDF Preview
Key Terms
Citation Network
Current paper (gray), citations (green), references (blue)
Display is limited for performance on very large graphs.
Similar Papers
Found 4 papersNo citations found for this paper.
Comments (0)