Estimating daily nitrogen dioxide level: Exploring traffic effects
Publication
Metrics
AI Quick Summary
This study developed a modified longitudinal model to estimate daily nitrogen dioxide levels, integrating data from traffic density, monthly measurements, and hourly monitoring stations to improve both temporal and spatial resolution. The inclusion of traffic data significantly enhanced model performance, offering a method to estimate $\mathrm {NO}_2$ exposure in areas without direct measurements.
Paper Preview
Abstract
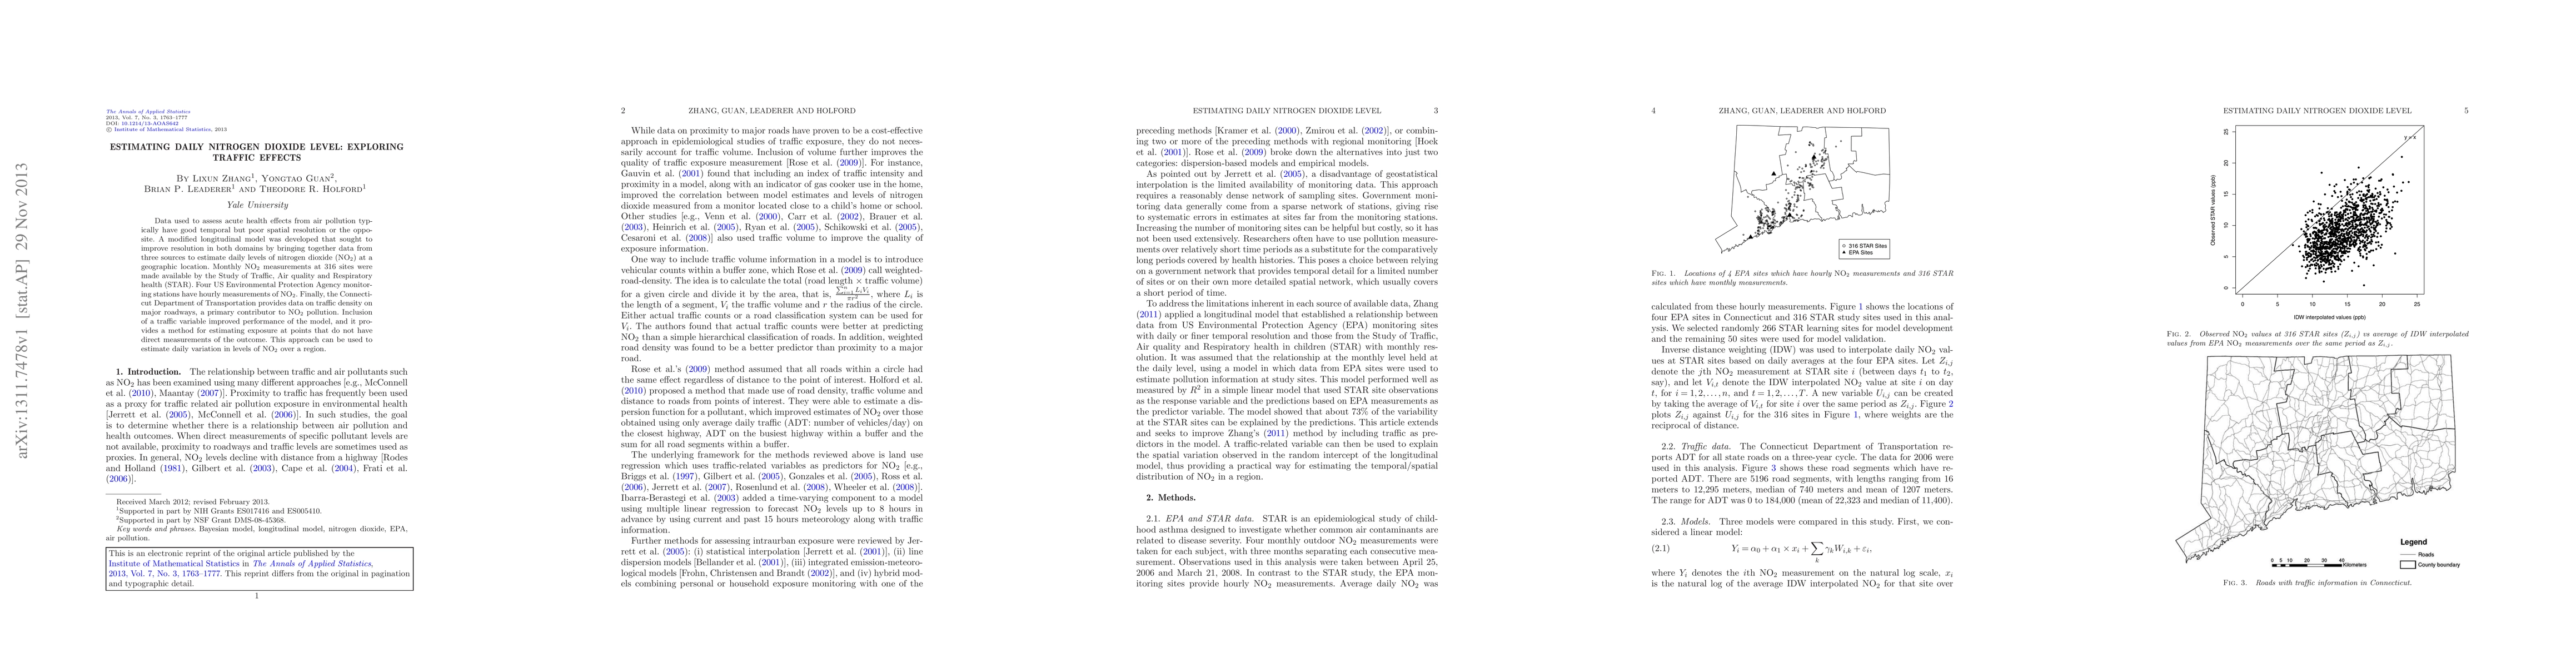
Data used to assess acute health effects from air pollution typically have good temporal but poor spatial resolution or the opposite. A modified longitudinal model was developed that sought to improve resolution in both domains by bringing together data from three sources to estimate daily levels of nitrogen dioxide ($\mathrm {NO}_2$) at a geographic location. Monthly $\mathrm {NO}_2$ measurements at 316 sites were made available by the Study of Traffic, Air quality and Respiratory health (STAR). Four US Environmental Protection Agency monitoring stations have hourly measurements of $\mathrm {NO}_2$. Finally, the Connecticut Department of Transportation provides data on traffic density on major roadways, a primary contributor to $\mathrm {NO}_2$ pollution. Inclusion of a traffic variable improved performance of the model, and it provides a method for estimating exposure at points that do not have direct measurements of the outcome. This approach can be used to estimate daily variation in levels of $\mathrm {NO}_2$ over a region.
AI Key Findings
Get AI-generated insights about this paper's methodology, results, significance, and more — seven facets brought into focus.
Impact
Paper Details
PDF Preview
Key Terms
Citation Network
Current paper (gray), citations (green), references (blue)
Display is limited for performance on very large graphs.
Discussion 0