Authors
Summary
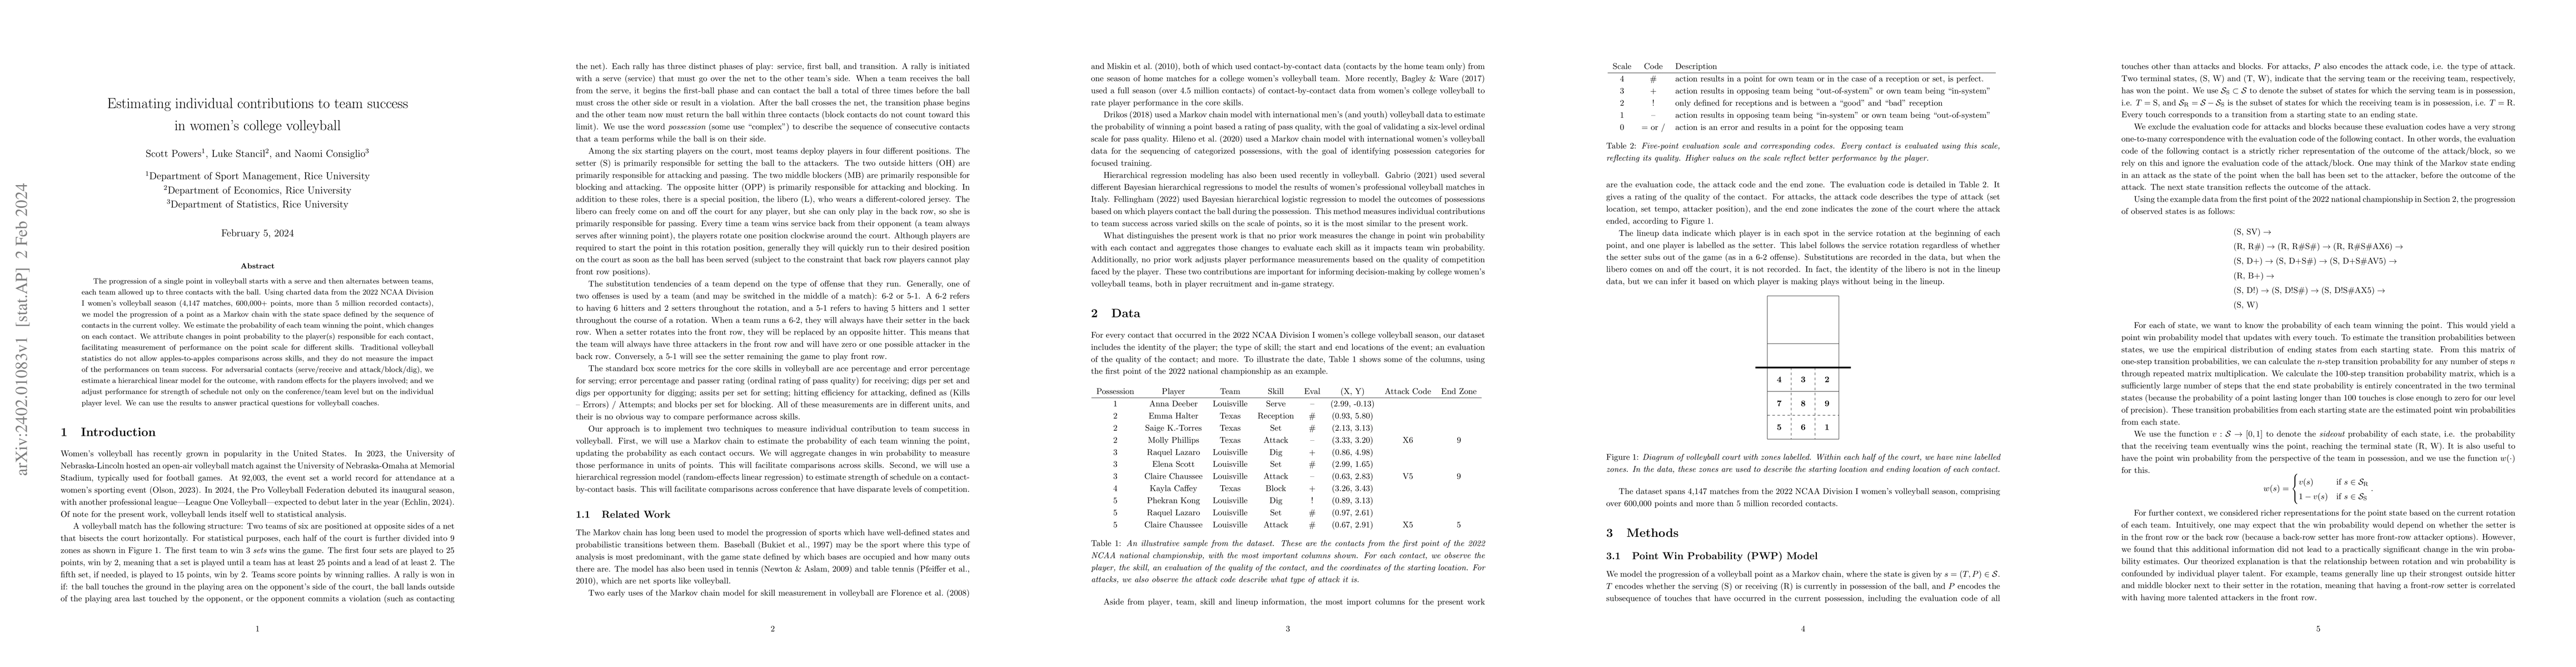
The progression of a single point in volleyball starts with a serve and then alternates between teams, each team allowed up to three contacts with the ball. Using charted data from the 2022 NCAA Division I women's volleyball season (4,147 matches, 600,000+ points, more than 5 million recorded contacts), we model the progression of a point as a Markov chain with the state space defined by the sequence of contacts in the current volley. We estimate the probability of each team winning the point, which changes on each contact. We attribute changes in point probability to the player(s) responsible for each contact, facilitating measurement of performance on the point scale for different skills. Traditional volleyball statistics do not allow apples-to-apples comparisons across skills, and they do not measure the impact of the performances on team success. For adversarial contacts (serve/receive and attack/block/dig), we estimate a hierarchical linear model for the outcome, with random effects for the players involved; and we adjust performance for strength of schedule not only on the conference/team level but on the individual player level. We can use the results to answer practical questions for volleyball coaches.
AI Key Findings
Get AI-generated insights about this paper's methodology, results, and significance.
Paper Details
PDF Preview
Key Terms
Citation Network
Current paper (gray), citations (green), references (blue)
Display is limited for performance on very large graphs.
Similar Papers
Found 4 papersBayesian estimation of in-game home team win probability for Division-I FBS college football
Jane L. Harvill, Ryan Sides, Jason T. Maddox
No citations found for this paper.
Comments (0)