Estimating stellar population and emission line properties in S-PLUS galaxies
Publication
Metrics
AI Quick Summary
This paper introduces a new method using the AlStar code to estimate stellar population and emission line properties from S-PLUS galaxy photometry. The technique achieves accurate recovery of stellar properties and emission lines, especially for strong lines, by incorporating empirical priors based on Hα and [N II] correlations.
Paper Preview
Abstract
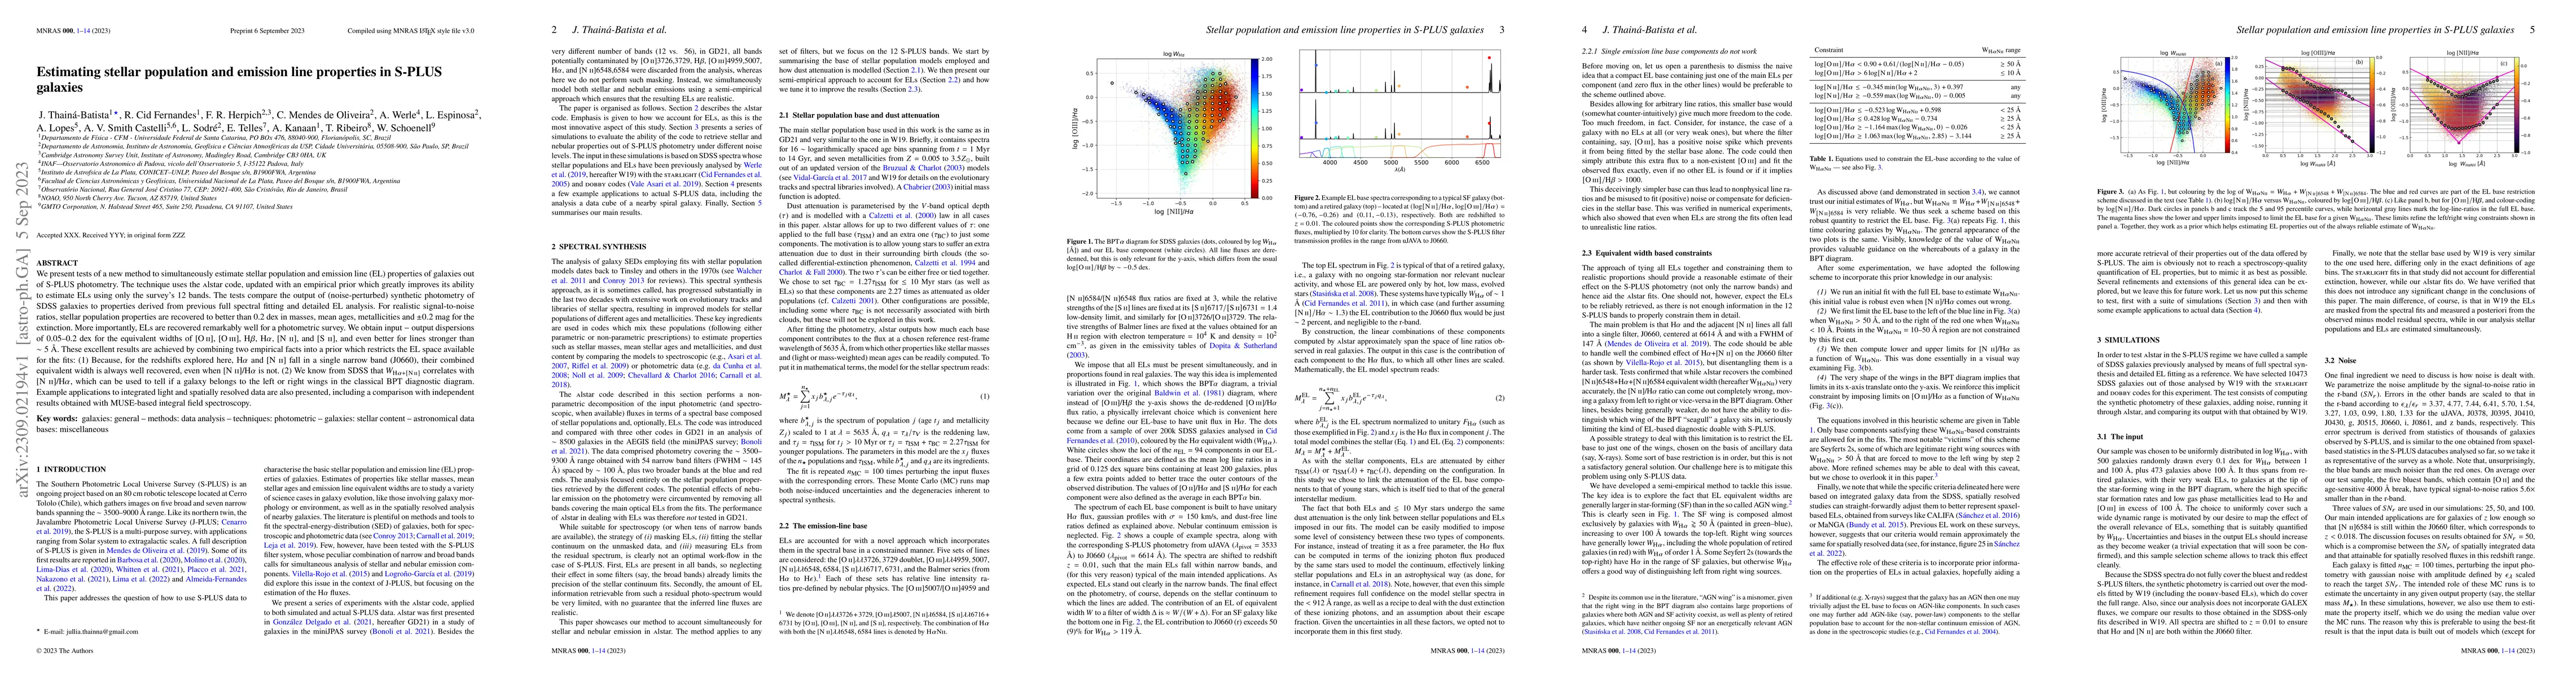
We present tests of a new method to simultaneously estimate stellar population and emission line (EL) properties of galaxies out of S-PLUS photometry. The technique uses the AlStar code, updated with an empirical prior which greatly improves its ability to estimate ELs using only the survey's 12 bands. The tests compare the output of (noise-perturbed) synthetic photometry of SDSS galaxies to properties derived from previous full spectral fitting and detailed EL analysis. For realistic signal-to-noise ratios, stellar population properties are recovered to better than 0.2 dex in masses, mean ages, metallicities and $\pm 0.2$ mag for the extinction. More importantly, ELs are recovered remarkably well for a photometric survey. We obtain input $-$ output dispersions of 0.05--0.2 dex for the equivalent widths of $[\mathrm{O}\,\rm{II}]$, $[\mathrm{O}\,\rm{III}]$, H$\beta$, H$\alpha$, $[\mathrm{N}\,\rm{II}]$, and $[\mathrm{S}\,\rm{II}]$, and even better for lines stronger than $\sim 5$ $\mathring{A}$. These excellent results are achieved by combining two empirical facts into a prior which restricts the EL space available for the fits: (1) Because, for the redshifts explored here, H$\alpha$ and $[\mathrm{N}\,\rm{II}]$ fall in a single narrow band (J0660), their combined equivalent width is always well recovered, even when $[\mathrm{N}\,\rm{II}]$/H$\alpha$ is not. (2) We know from SDSS that $W_{H\alpha+[\mathrm{N}\,\rm{II}]}$ correlates with $[\mathrm{N}\,\rm{II}]$/H$\alpha$, which can be used to tell if a galaxy belongs to the left or right wings in the classical BPT diagnostic diagram. Example applications to integrated light and spatially resolved data are also presented, including a comparison with independent results obtained with MUSE-based integral field spectroscopy.
AI Key Findings
Get AI-generated insights about this paper's methodology, results, significance, and more — seven facets brought into focus.
Impact
Paper Details
Authors
PDF Preview
Key Terms
Citation Network
Current paper (gray), citations (green), references (blue)
Display is limited for performance on very large graphs.
Discussion 0