Summary
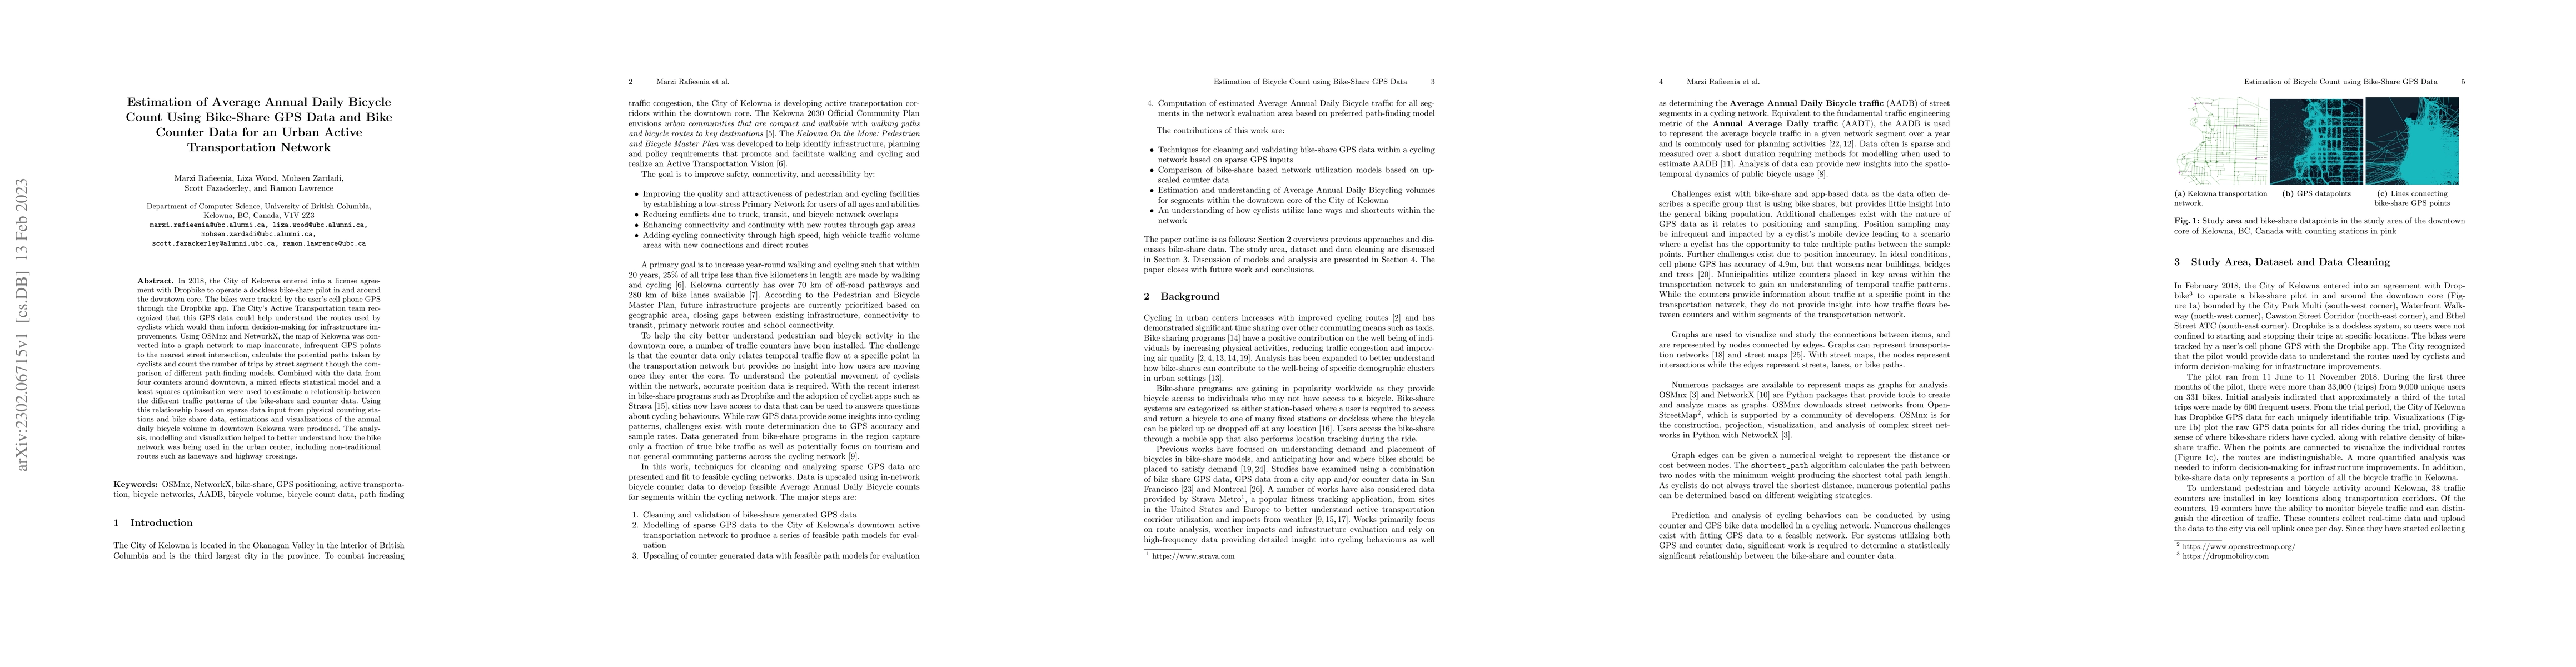
In 2018, the City of Kelowna entered into a license agreement with Dropbike to operate a dockless bike-share pilot in and around the downtown core. The bikes were tracked by the user's cell phone GPS through the Dropbike app. The City's Active Transportation team recognized that this GPS data could help understand the routes used by cyclists which would then inform decision-making for infrastructure improvements. Using OSMnx and NetworkX, the map of Kelowna was converted into a graph network to map inaccurate, infrequent GPS points to the nearest street intersection, calculate the potential paths taken by cyclists and count the number of trips by street segment though the comparison of different path-finding models. Combined with the data from four counters around downtown, a mixed effects statistical model and a least squares optimization were used to estimate a relationship between the different traffic patterns of the bike-share and counter data. Using this relationship based on sparse data input from physical counting stations and bike share data, estimations and visualizations of the annual daily bicycle volume in downtown Kelowna were produced. The analysis, modelling and visualization helped to better understand how the bike network was being used in the urban center, including non-traditional routes such as laneways and highway crossings.
AI Key Findings
Get AI-generated insights about this paper's methodology, results, and significance.
Paper Details
PDF Preview
Key Terms
Citation Network
Current paper (gray), citations (green), references (blue)
Display is limited for performance on very large graphs.
Similar Papers
Found 4 papersBike network planning in limited urban space
Martin Raubal, Nina Wiedemann, Christian Nöbel et al.
Classifying Bicycle Infrastructure Using On-Bike Street-Level Images
Kal Backman, Dana Kulić, Ben Beck
No citations found for this paper.
Comments (0)