Estimation of temporal covariances in pathogen dynamics using Bayesian multivariate autoregressive models
Publication
Metrics
AI Quick Summary
This paper develops a Bayesian multivariate autoregressive model to estimate temporal covariances among multiple pathogens' infection time-series, revealing epidemiological interactions between specific virus pairs. The approach accounts for confounding factors and is validated using both simulated and real diagnostic data from five respiratory viruses.
Paper Preview
Abstract
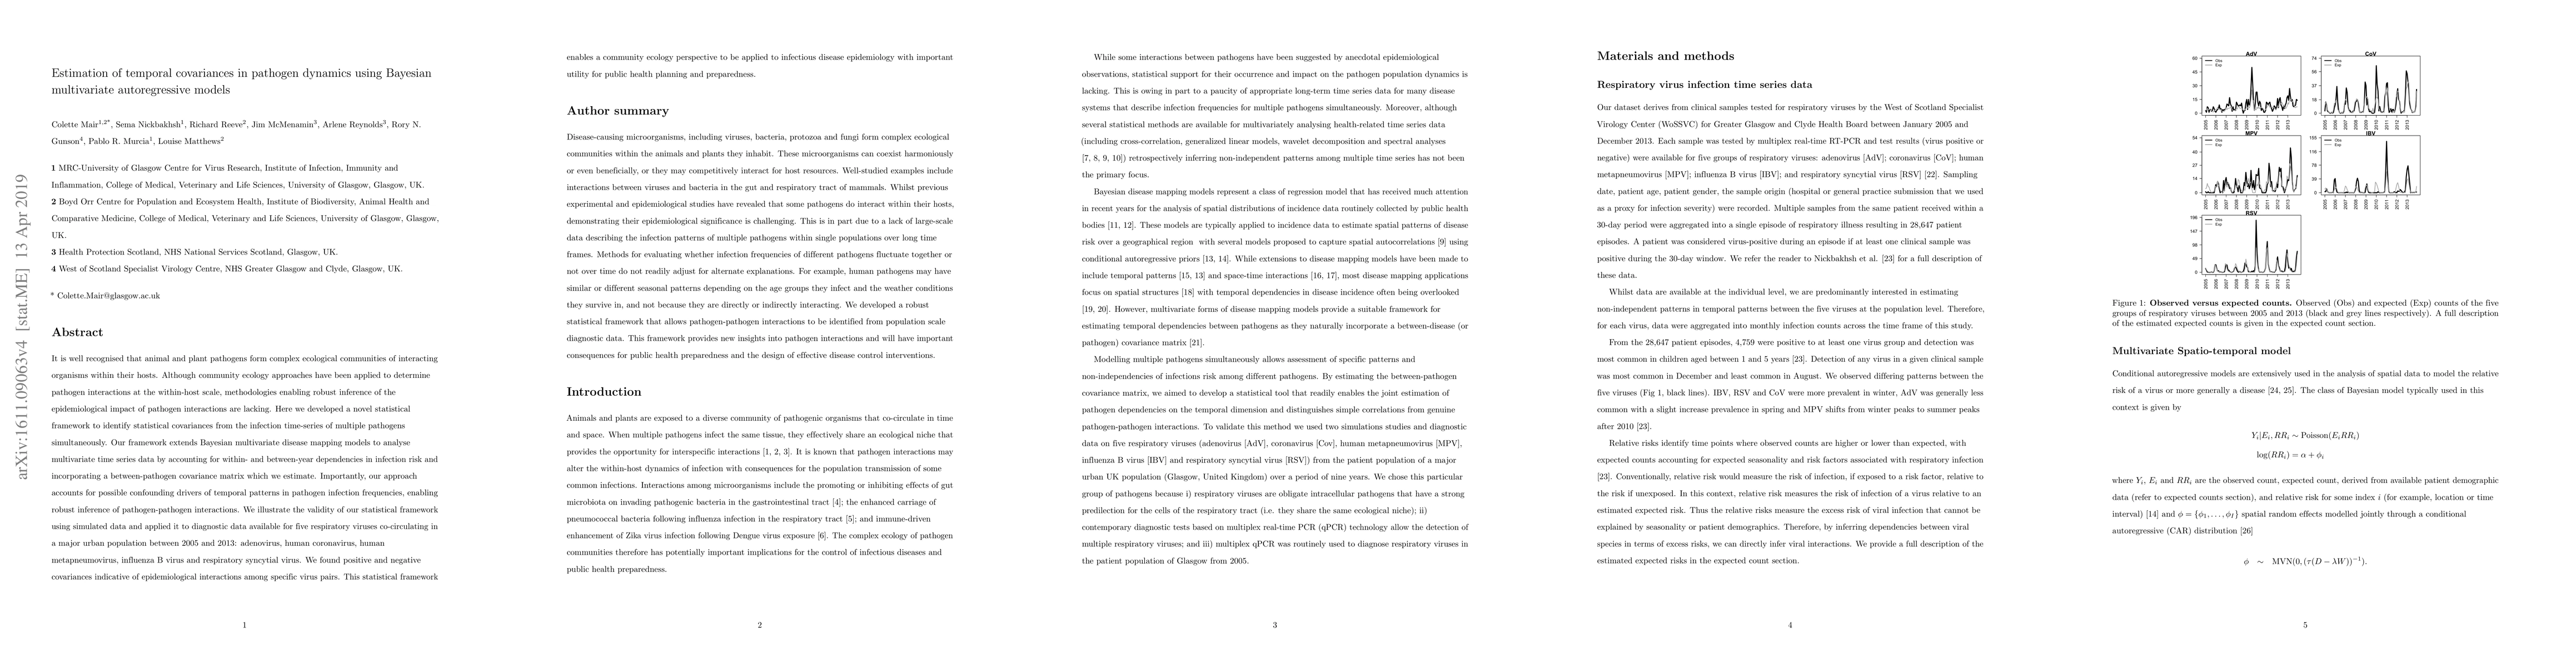
It is well recognised that animal and plant pathogens form complex ecological communities of interacting organisms within their hosts. Although community ecology approaches have been applied to determine pathogen interactions at the within-host scale, methodologies enabling robust inference of the epidemiological impact of pathogen interactions are lacking. Here we developed a novel statistical framework to identify statistical covariances from the infection time-series of multiple pathogens simultaneously. Our framework extends Bayesian multivariate disease mapping models to analyse multivariate time series data by accounting for within- and between-year dependencies in infection risk and incorporating a between-pathogen covariance matrix which we estimate. Importantly, our approach accounts for possible confounding drivers of temporal patterns in pathogen infection frequencies, enabling robust inference of pathogen-pathogen interactions. We illustrate the validity of our statistical framework using simulated data and applied it to diagnostic data available for five respiratory viruses co-circulating in a major urban population between 2005 and 2013: adenovirus, human coronavirus, human metapneumovirus, influenza B virus and respiratory syncytial virus. We found positive and negative covariances indicative of epidemiological interactions among specific virus pairs. This statistical framework enables a community ecology perspective to be applied to infectious disease epidemiology with important utility for public health planning and preparedness.
AI Key Findings
Get AI-generated insights about this paper's methodology, results, significance, and more — seven facets brought into focus.
Impact
Paper Details
PDF Preview
Key Terms
Citation Network
Current paper (gray), citations (green), references (blue)
Display is limited for performance on very large graphs.
Discussion 0