Euclid preparation: Extracting physical parameters from galaxies with machine learning
Publication
Metrics
AI Quick Summary
This study explores using machine learning to extract physical parameters from Euclid's imaging data, focusing on stellar mass surface density, metallicity, and age. They simulate Euclid-like images from a cosmological simulation and find machine learning can accurately recover stellar mass surface density but less reliably estimate metallicity and age due to underlying correlations.
Paper Preview
Abstract
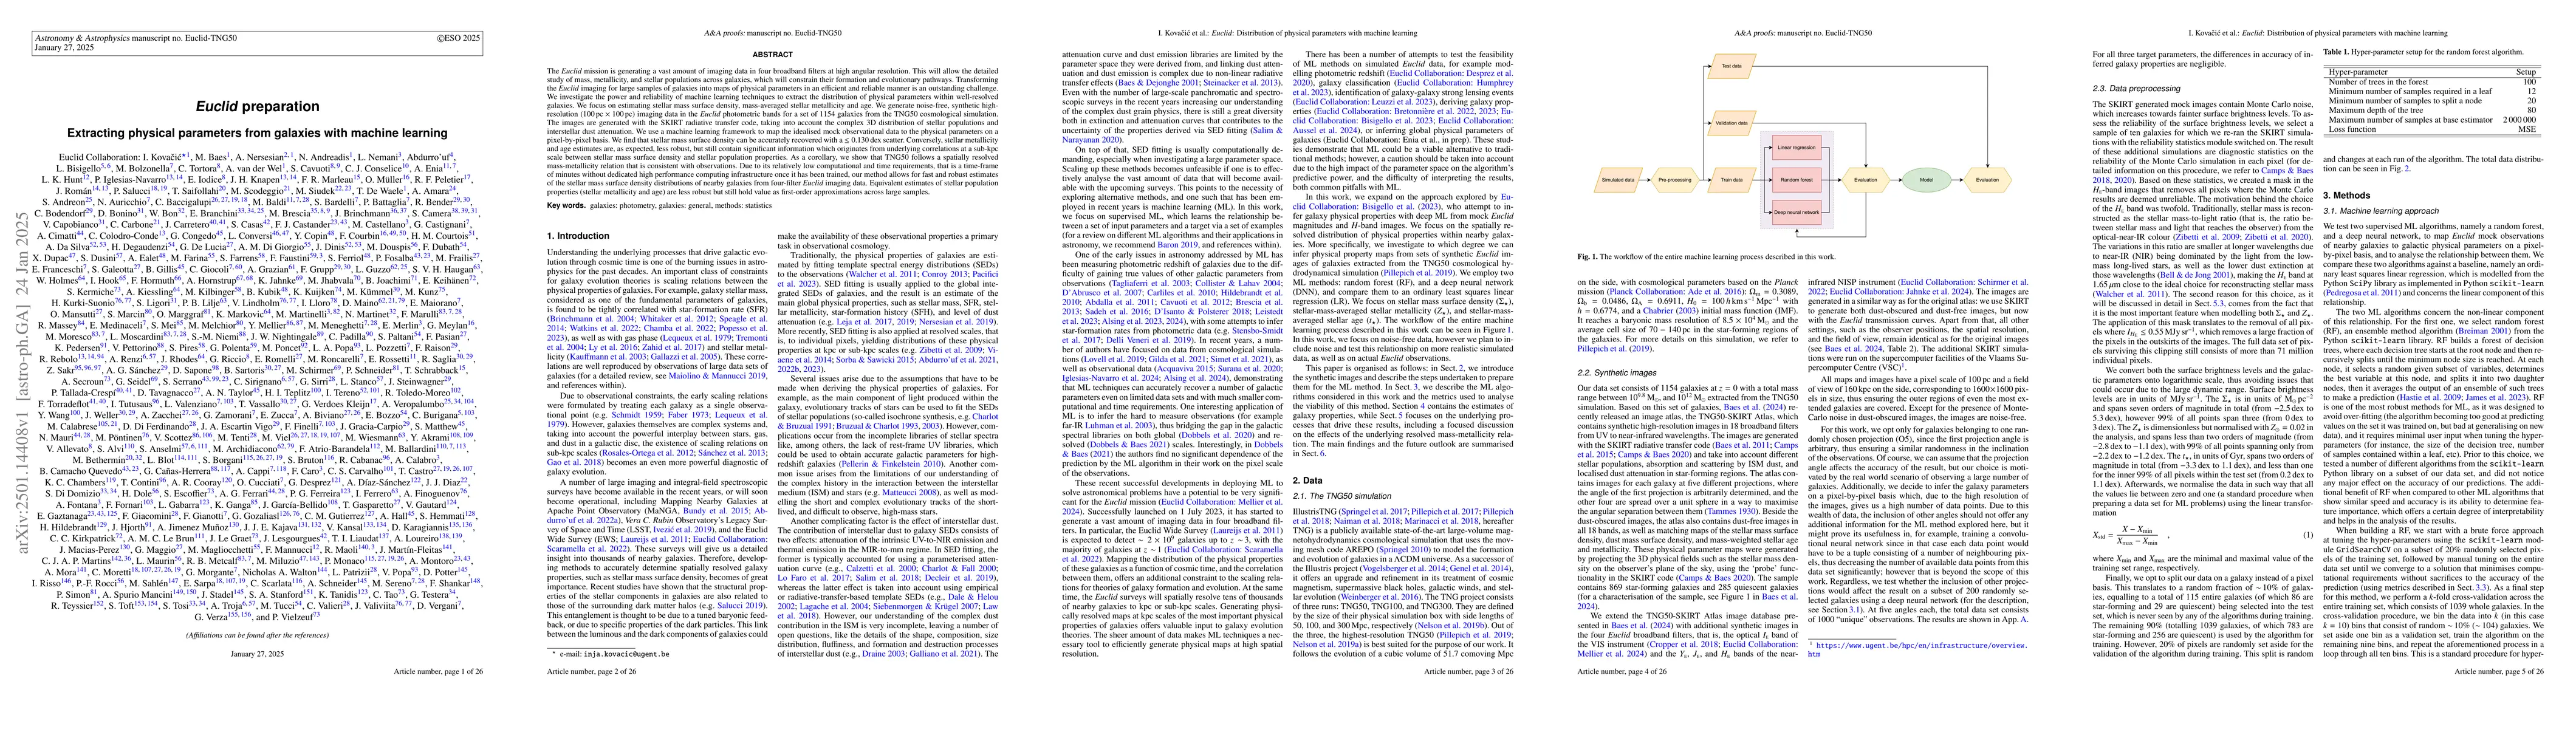
The Euclid mission is generating a vast amount of imaging data in four broadband filters at high angular resolution. This will allow the detailed study of mass, metallicity, and stellar populations across galaxies, which will constrain their formation and evolutionary pathways. Transforming the Euclid imaging for large samples of galaxies into maps of physical parameters in an efficient and reliable manner is an outstanding challenge. We investigate the power and reliability of machine learning techniques to extract the distribution of physical parameters within well-resolved galaxies. We focus on estimating stellar mass surface density, mass-averaged stellar metallicity and age. We generate noise-free, synthetic high-resolution imaging data in the Euclid photometric bands for a set of 1154 galaxies from the TNG50 cosmological simulation. The images are generated with the SKIRT radiative transfer code, taking into account the complex 3D distribution of stellar populations and interstellar dust attenuation. We use a machine learning framework to map the idealised mock observational data to the physical parameters on a pixel-by-pixel basis. We find that stellar mass surface density can be accurately recovered with a $\leq 0.130 {\rm \,dex}$ scatter. Conversely, stellar metallicity and age estimates are, as expected, less robust, but still contain significant information which originates from underlying correlations at a sub-kpc scale between stellar mass surface density and stellar population properties.
AI Key Findings
Get AI-generated insights about this paper's methodology, results, significance, and more — seven facets brought into focus.
Impact
Authors
PDF Preview
Citation Network
Current paper (gray), citations (green), references (blue)
Display is limited for performance on very large graphs.
Discussion 0