Evaluating judgment of spatial correlation in visual displays of scalar field distributions
Publication
Metrics
Paper Preview
Abstract
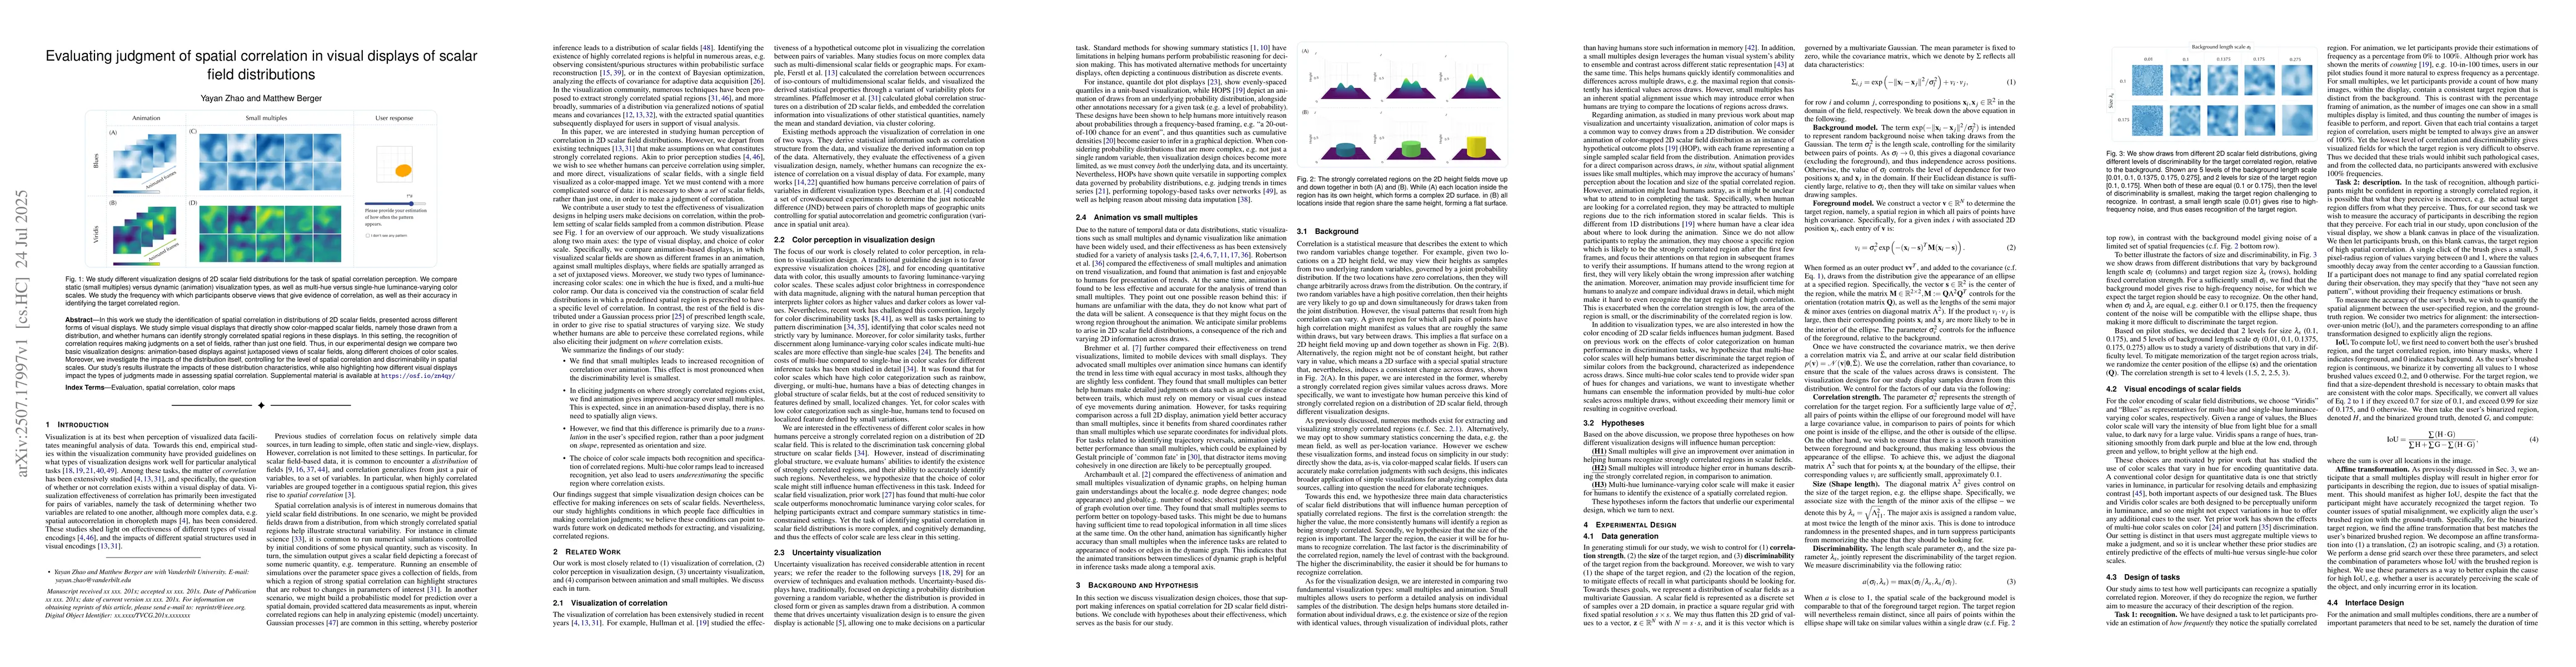
In this work we study the identification of spatial correlation in distributions of 2D scalar fields, presented across different forms of visual displays. We study simple visual displays that directly show color-mapped scalar fields, namely those drawn from a distribution, and whether humans can identify strongly correlated spatial regions in these displays. In this setting, the recognition of correlation requires making judgments on a set of fields, rather than just one field. Thus, in our experimental design we compare two basic visualization designs: animation-based displays against juxtaposed views of scalar fields, along different choices of color scales. Moreover, we investigate the impacts of the distribution itself, controlling for the level of spatial correlation and discriminability in spatial scales. Our study's results illustrate the impacts of these distribution characteristics, while also highlighting how different visual displays impact the types of judgments made in assessing spatial correlation. Supplemental material is available at https://osf.io/zn4qy
AI Key Findings
Get AI-generated insights about this paper's methodology, results, significance, and more — seven facets brought into focus.
Impact
Authors
PDF Preview
Citation Network
Current paper (gray), citations (green), references (blue)
Display is limited for performance on very large graphs.
Discussion 0