Publication
Metrics
AI Quick Summary
This paper proposes a method to evaluate local explanation techniques using the log odds ratio (LOR) for white-box models like logistic regression and naive Bayes, instead of relying on costly human assessments. It benchmarks various explanation techniques based on their similarity to LOR scores, revealing that performance varies with model type, dataset, data point, data normalization, and similarity metric.
Paper Preview
Abstract
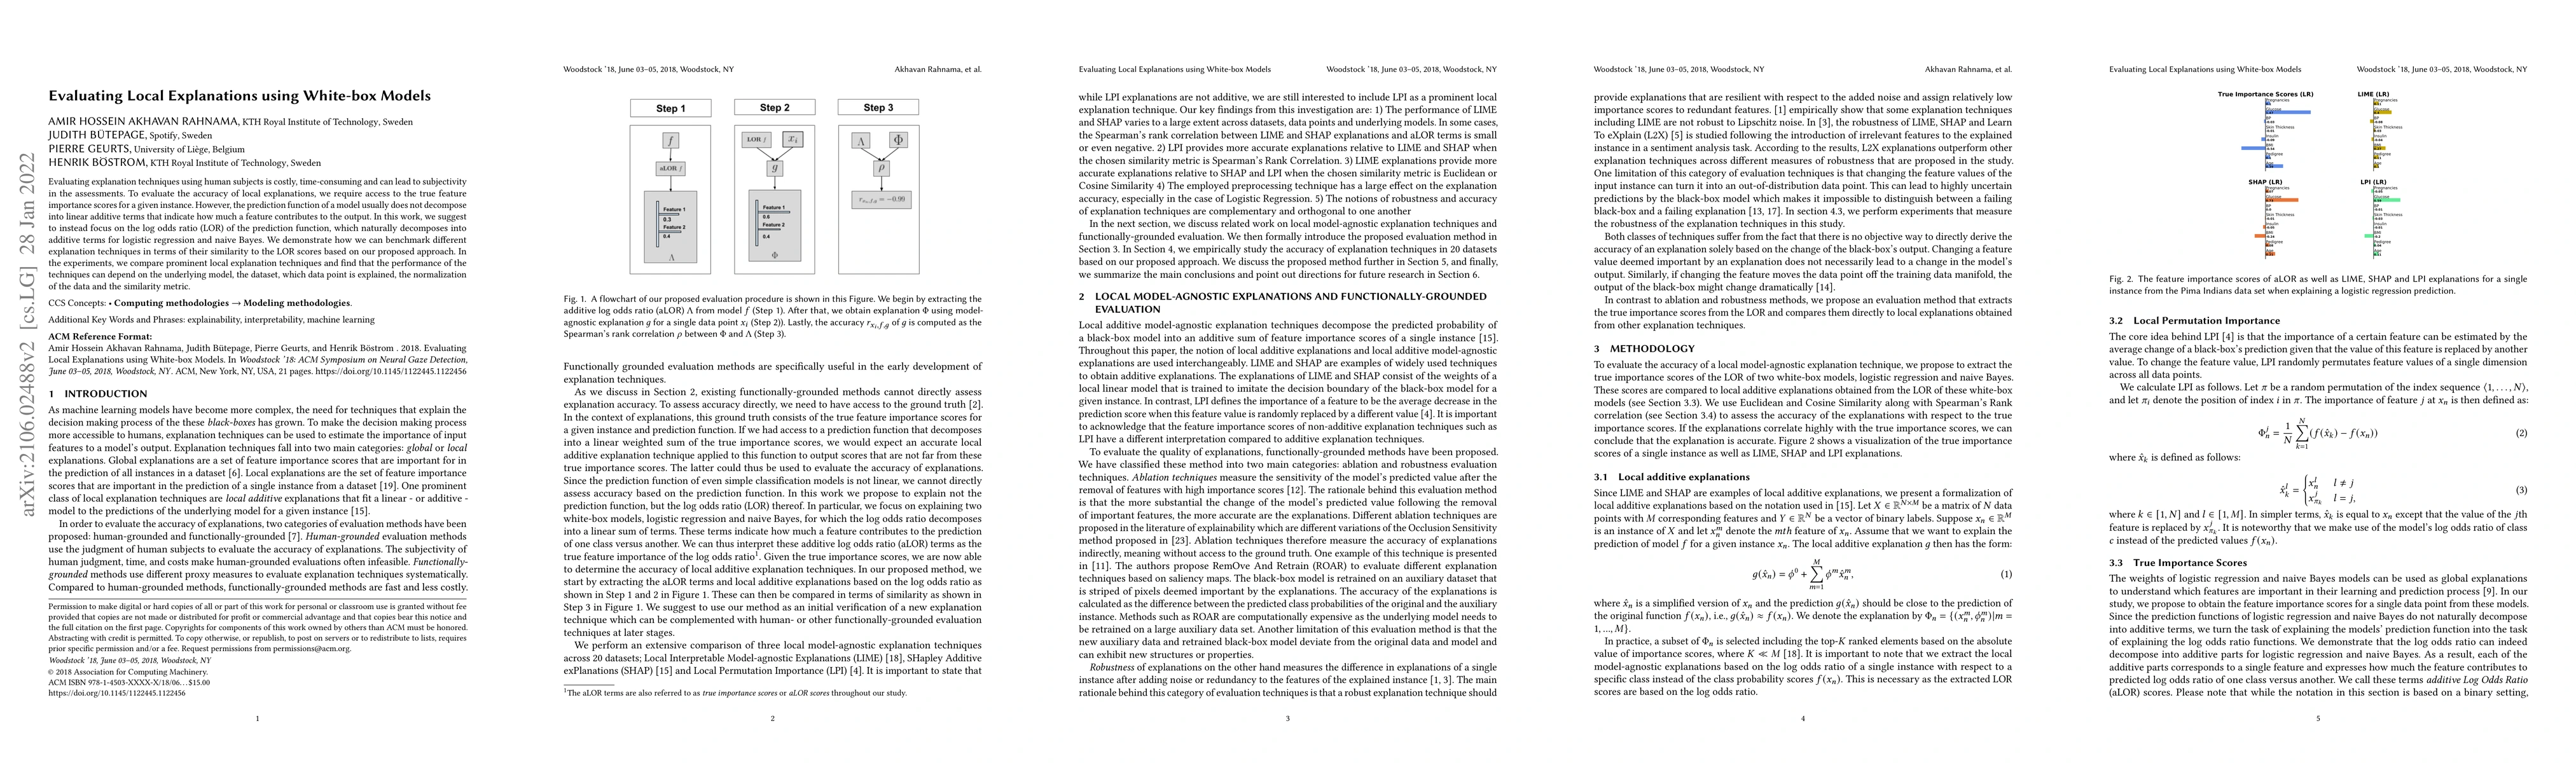
Evaluating explanation techniques using human subjects is costly, time-consuming and can lead to subjectivity in the assessments. To evaluate the accuracy of local explanations, we require access to the true feature importance scores for a given instance. However, the prediction function of a model usually does not decompose into linear additive terms that indicate how much a feature contributes to the output. In this work, we suggest to instead focus on the log odds ratio (LOR) of the prediction function, which naturally decomposes into additive terms for logistic regression and naive Bayes. We demonstrate how we can benchmark different explanation techniques in terms of their similarity to the LOR scores based on our proposed approach. In the experiments, we compare prominent local explanation techniques and find that the performance of the techniques can depend on the underlying model, the dataset, which data point is explained, the normalization of the data and the similarity metric.
AI Key Findings
Get AI-generated insights about this paper's methodology, results, significance, and more — seven facets brought into focus.
Impact
Paper Details
Authors
PDF Preview
Key Terms
Citation Network
Current paper (gray), citations (green), references (blue)
Display is limited for performance on very large graphs.
Discussion 0