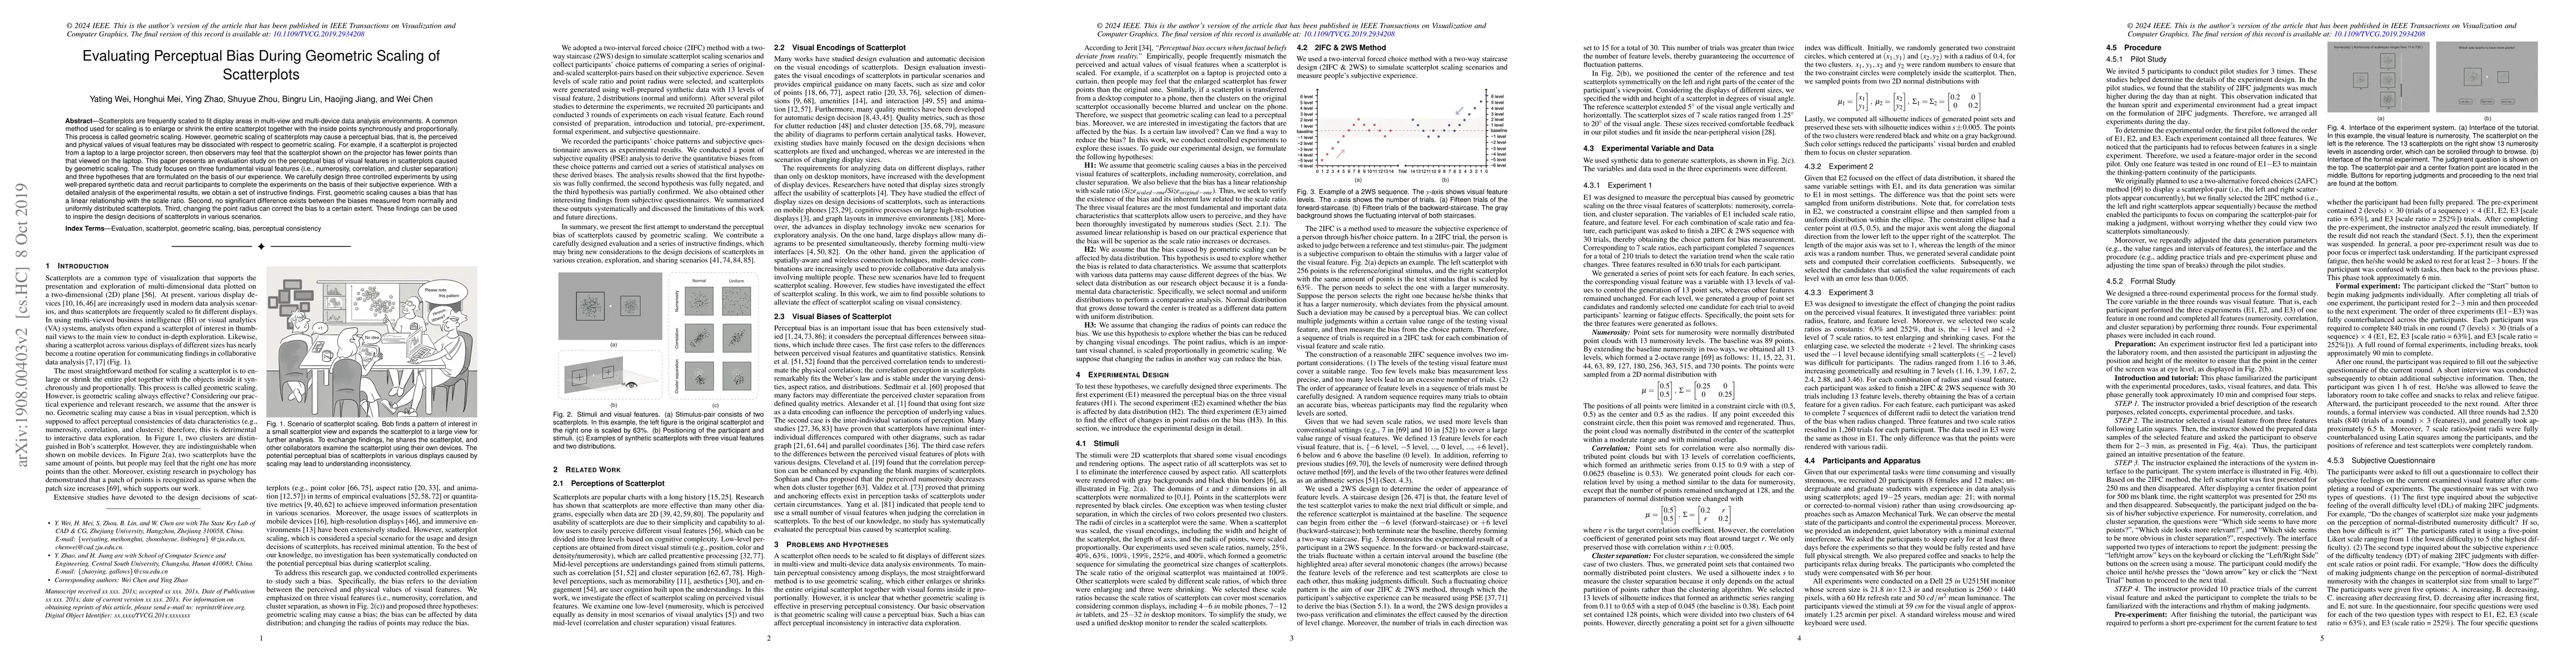
Scatterplots are frequently scaled to fit display areas in multi-view and multi-device data analysis environments. A common method used for scaling is to enlarge or shrink the entire scatterplot together with the inside points synchronously and proportionally. This process is called geometric scaling. However, geometric scaling of scatterplots may cause a perceptual bias, that is, the perceived and physical values of visual features may be dissociated with respect to geometric scaling. For example, if a scatterplot is projected from a laptop to a large projector screen, then observers may feel that the scatterplot shown on the projector has fewer points than that viewed on the laptop. This paper presents an evaluation study on the perceptual bias of visual features in scatterplots caused by geometric scaling. The study focuses on three fundamental visual features (i.e., numerosity, correlation, and cluster separation) and three hypotheses that are formulated on the basis of our experience. We carefully design three controlled experiments by using well-prepared synthetic data and recruit participants to complete the experiments on the basis of their subjective experience. With a detailed analysis of the experimental results, we obtain a set of instructive findings. First, geometric scaling causes a bias that has a linear relationship with the scale ratio. Second, no significant difference exists between the biases measured from normally and uniformly distributed scatterplots. Third, changing the point radius can correct the bias to a certain extent. These findings can be used to inspire the design decisions of scatterplots in various scenarios.
Get AI-generated insights about this paper's methodology, results, and significance.
Current paper (gray), citations (green), references (blue)
Khairi Reda, Oliver Deussen, Yunhai Wang et al.
Jinwook Seo, Hyeon Jeon, Taehyun Yang
Jiayi Chen, Shuo Li, Wei Dai et al.
Michael Sedlmair, Mostafa M. Abbas, Ehsan Ullah et al.
Title | Authors | Year | Actions |
---|---|---|---|
Visualization-Driven Illumination for Density Plots
|
Xin Chen, Yunhai Wang, Huaiwei Bao, Kecheng Lu, Jaemin Jo, Chi-Wing Fu, Jean-Daniel Fekete
|
2024
|
View Paper |
Effects of outlier and familiar context in trend-line estimates in scatterplots.
|
Başak Oral, Aysecan Boduroglu
|
2024
|
View Paper |
Offsetting Perceptual Bias in Visual Clustering: The Role of Point Size Adjustment in Variable Display Sizes
|
Taehyun Yang, Hyeon Jeon, Jinwook Seo
|
2024
|
View Paper |
Measuring Categorical Perception in Color-Coded Scatterplots
|
Chin Tseng, Ghulam Jilani Quadri, Zeyu Wang, D. Szafir
|
2023
|
View Paper |
Evaluating Visual Consistency of Icon Usage in Across-Devices
|
Xiaojiao Chen, Xiaodong Tang, Ying Zhao, Tengyu Huang, Ran Qian, Jiayi Zhang, Wei Chen, Xiaosong Wang
|
2023
|
View Paper |
A study of the effect of star glyph parameters on value estimation and comparison
|
Yihan Hou, Haotian Zhu, Hai-Ning Liang, Lingyun Yu
|
2022
|
View Paper |
PNMAVis: Visual Analysis Tool of Protein Normal Mode for Understanding Cavity Dynamics
|
Dongliang Guo, Li Feng, Taoxiang Zhang, Ya. Guo, Yanfen Wang, Ximing Xu
|
2022
|
View Paper |
Effective Use of Likert Scales in Visualization Evaluations: A Systematic Review
|
Laura South, David Saffo, Olga Vitek, Cody Dunne, M. Borkin
|
2022
|
View Paper |
Nirmaan: Dataset generation for multiclass scatterplot studies
|
Wong Allison, Joshi Alark, Engle Sophie
|
2022
|
View Paper |
Responsive Visualization Design for Mobile Devices
|
Tom Horak, W. Aigner, M. Brehmer, Alark Joshi, C. Tominski
|
2021
|
View Paper |
A benchmark for visual analysis of insider threat detection
|
Ying Zhao, Kui Yang, Siming Chen, Zhuo Zhang, Xin Huang, Qiusheng Li, Qi Ma, Xinyue Luan, Xiao-xing Fan
|
2021
|
View Paper |
An evolutional model for operation-driven visualization design
|
Yating Wei, Honghui Mei, Wenqi Huang, Xiang-yang Wu, Mingliang Xu, Wei Chen
|
2021
|
View Paper |
The Weighted Average Illusion: Biases in Perceived Mean Position in Scatterplots
|
Matt-Heun Hong, J. Witt, D. Szafir
|
2021
|
View Paper |
Visual Abstraction of Geographical Point Data with Spatial Autocorrelations
|
Zhiguang Zhou, Xinlong Zhang, Zhendong Yang, Yuanyuan Chen, Yuhua Liu, Jin Wen, Binjie Chen, Ying Zhao, Wei Chen
|
2020
|
View Paper |
Preserving Minority Structures in Graph Sampling
|
Ying Zhao, Haojin Jiang, Qi'an Chen, Yaqi Qin, Huixuan Xie, Yitao Wu, Shixia Liu, Zhiguang Zhou, Jiazhi Xia, Fangfang Zhou
|
2020
|
View Paper |
Reverse-engineering bar charts using neural networks
|
Fangfang Zhou, Yong Zhao, Wenjiang Chen, Yijing Tan, Yaqi Xu, Yi Chen, Chao Liu, Ying Zhao
|
2020
|
View Paper |
SilkViser: A Visual Explorer of Blockchain-based Cryptocurrency Transaction Data
|
Zengsheng Zhong, Shuirun Wei, Yeting Xu, Ying Zhao, Fangfang Zhou, Feng Luo, Ronghua Shi
|
2020
|
View Paper |
STULL: Unbiased Online Sampling for Visual Exploration of Large Spatiotemporal Data
|
Guizhen Wang, Jingjing Guo, Mingjie Tang, J. Q. Neto, Calvin Yau, Anas Daghistani, M. Karimzadeh, W. Aref, D. Ebert
|
2020
|
View Paper |
Embodied Navigation in Immersive Abstract Data Visualization: Is Overview+Detail or Zooming Better for 3D Scatterplots?
|
Yalong Yang, Maxime Cordeil, Johanna Beyer, Tim Dwyer, K. Marriott, H. Pfister
|
2020
|
View Paper |
Evaluation of Sampling Methods for Scatterplots
|
Jun Yuan, Shouxing Xiang, Jiazhi Xia, Lingyun Yu, Shixia Liu
|
2020
|
View Paper |
The influence of font scale on semantic expression of word cloud
|
Lu-Biao Yang, Jie Li, Wenhuan Lu, Yi Chen, Kang Zhang, Yan Li
|
2020
|
View Paper |
Studying Parallel Coordinates Under Varying Aspect Ratios
|
Leon Meka, Mirjam Kronsteiner, Johanna Schmidt
|
2025
|
View Paper |
Comments (0)