Evaluating the Effect of Enhanced Text-Visualization Integration on Combating Misinformation in Data Story
Publication
Metrics
AI Quick Summary
This paper investigates how enhanced text-visualization integration can combat misinformation in data stories. The study finds that explanatory annotation and interactive linking can lower perceived credibility, though participants still struggle to identify misinformation, suggesting potential for defensive design methods to mitigate misinformation.
Paper Preview
Abstract
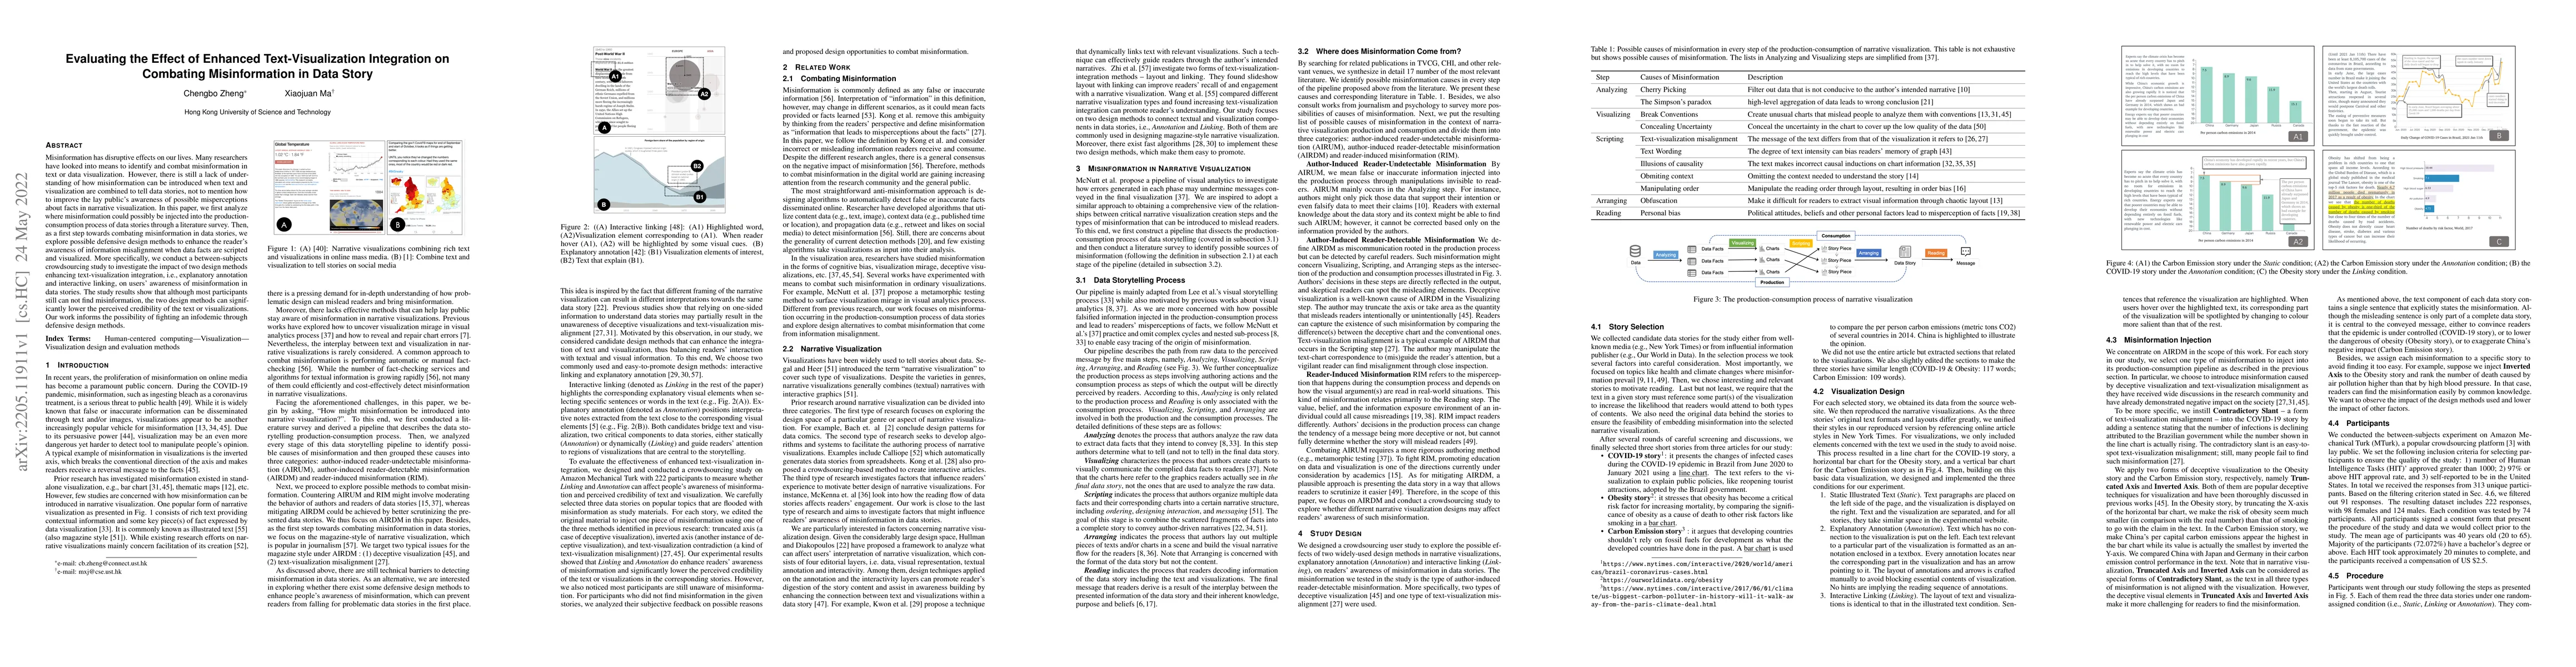
Misinformation has disruptive effects on our lives. Many researchers have looked into means to identify and combat misinformation in text or data visualization. However, there is still a lack of understanding of how misinformation can be introduced when text and visualization are combined to tell data stories, not to mention how to improve the lay public's awareness of possible misperceptions about facts in narrative visualization. In this paper, we first analyze where misinformation could possibly be injected into the production-consumption process of data stories through a literature survey. Then, as a first step towards combating misinformation in data stories, we explore possible defensive design methods to enhance the reader's awareness of information misalignment when data facts are scripted and visualized. More specifically, we conduct a between-subjects crowdsourcing study to investigate the impact of two design methods enhancing text-visualization integration, i.e., explanatory annotation and interactive linking, on users' awareness of misinformation in data stories. The study results show that although most participants still can not find misinformation, the two design methods can significantly lower the perceived credibility of the text or visualizations. Our work informs the possibility of fighting an infodemic through defensive design methods.
AI Key Findings
Get AI-generated insights about this paper's methodology, results, significance, and more — seven facets brought into focus.
Impact
Paper Details
Authors
PDF Preview
Key Terms
Citation Network
Current paper (gray), citations (green), references (blue)
Display is limited for performance on very large graphs.
Discussion 0