Evaluating the Overhead of the Performance Profiler Cloudprofiler With MooBench
Publication
Metrics
AI Quick Summary
This study measures the performance overhead of Cloudprofiler, a C++-based performance profiler, using MooBench to evaluate its efficiency in cloud-native architectures. Cloudprofiler demonstrates an average execution time of 2.28 microseconds with its buffered ID handler and Zstandard compression, which is 6.15 times faster than its non-optimized counterpart.
Paper Preview
Abstract
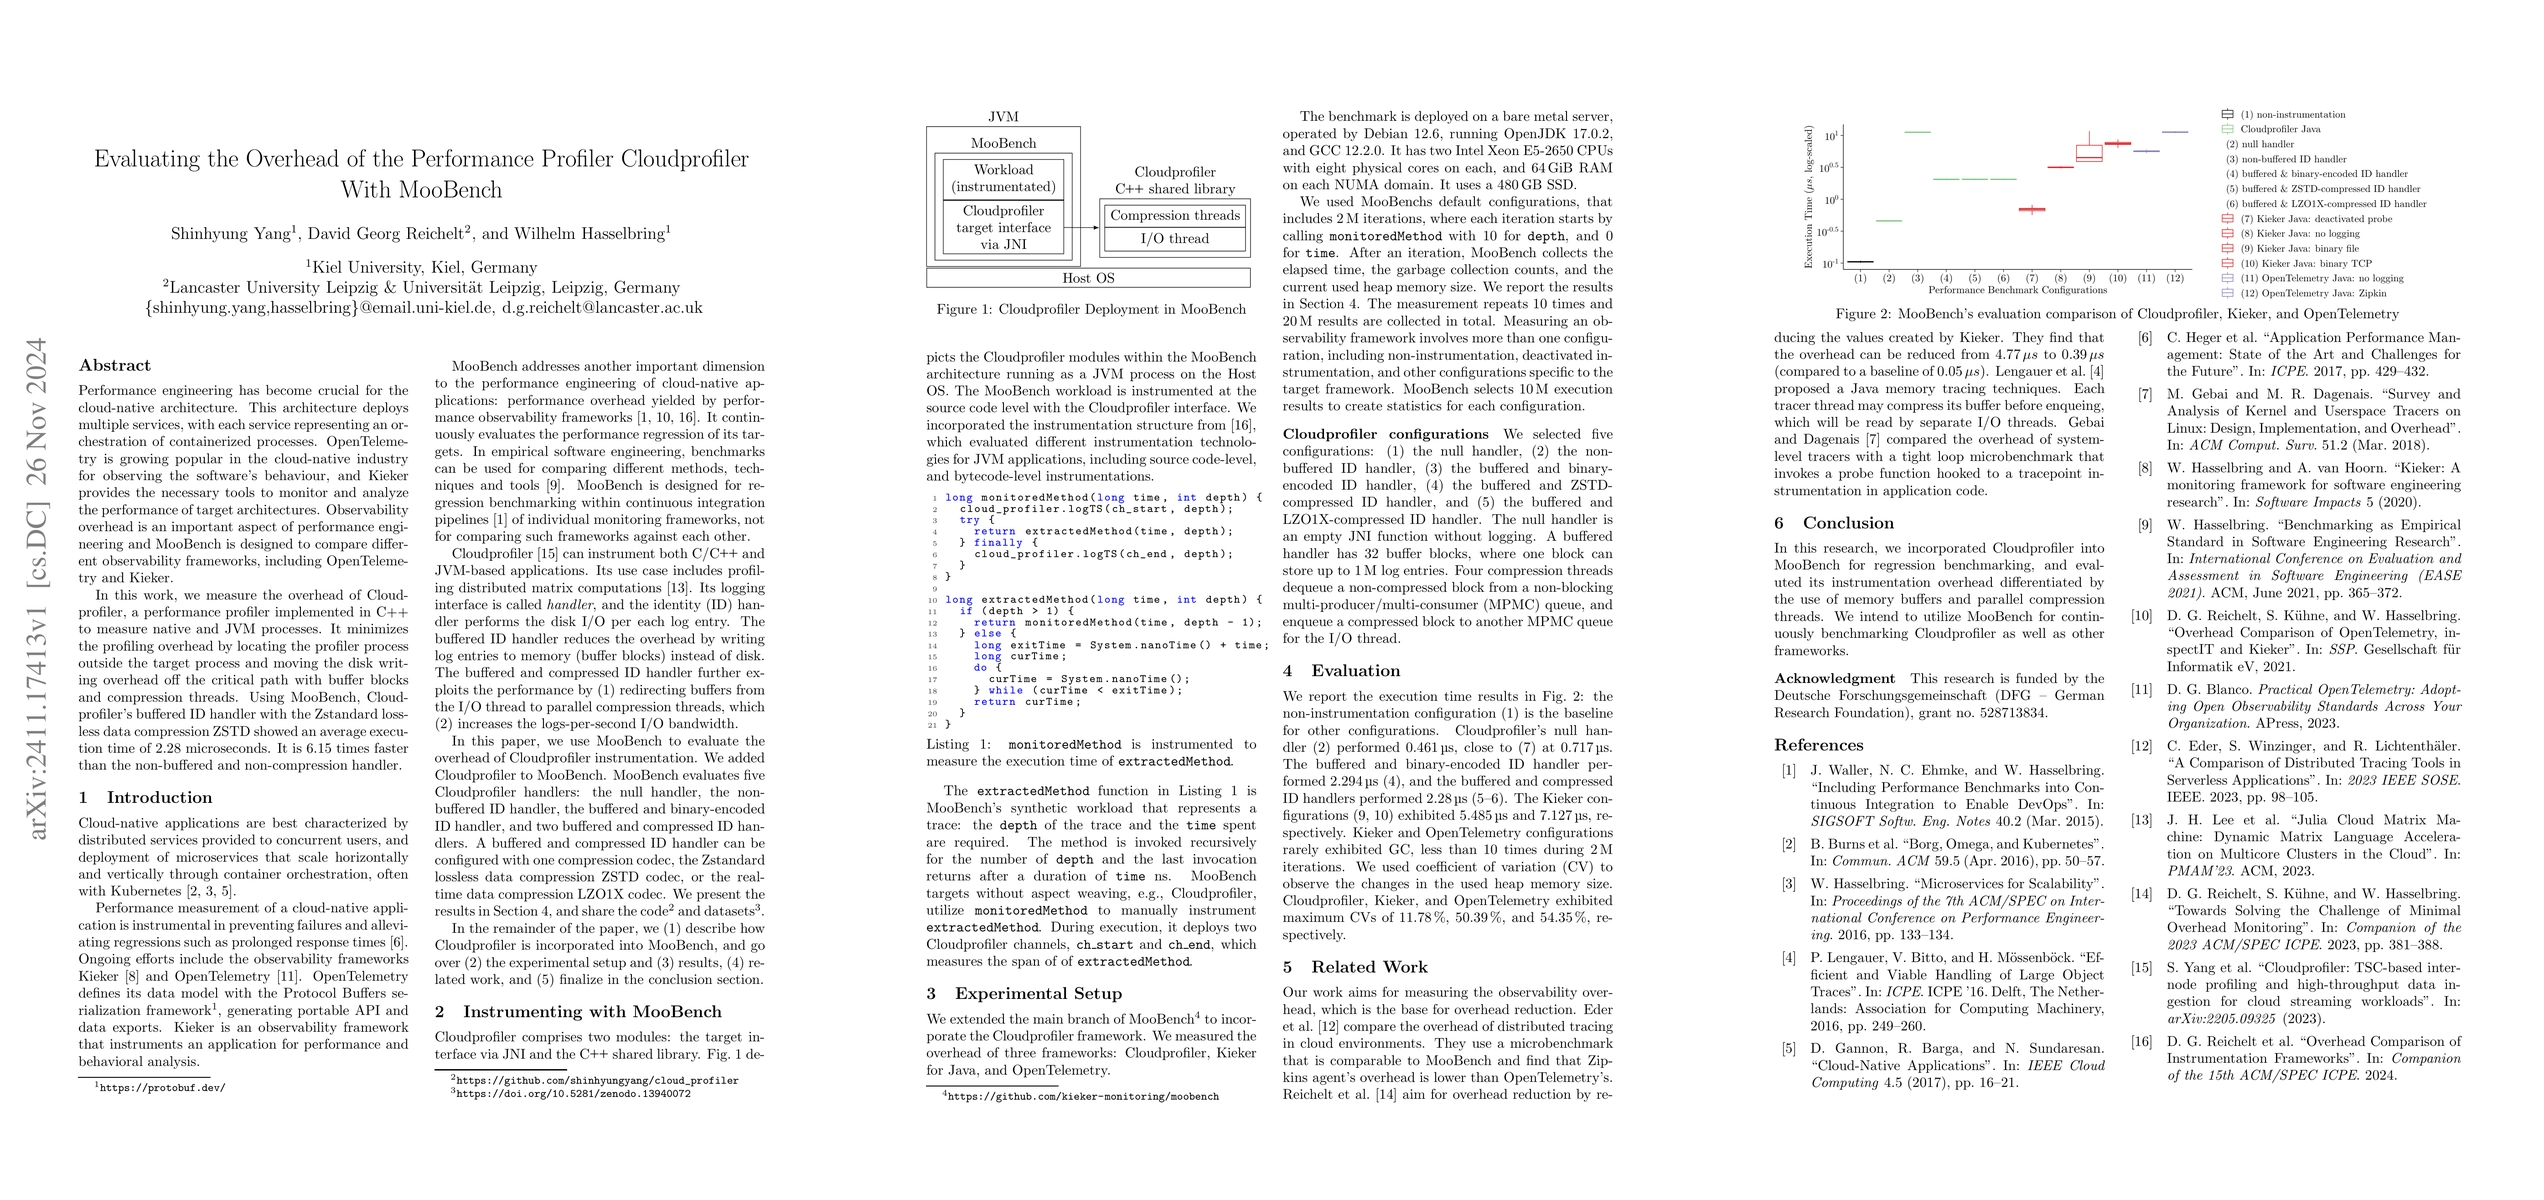
Performance engineering has become crucial for the cloud-native architecture. This architecture deploys multiple services, with each service representing an orchestration of containerized processes. OpenTelemetry is growing popular in the cloud-native industry for observing the software's behaviour, and Kieker provides the necessary tools to monitor and analyze the performance of target architectures. Observability overhead is an important aspect of performance engineering and MooBench is designed to compare different observability frameworks, including OpenTelemetry and Kieker. In this work, we measure the overhead of Cloudprofiler, a performance profiler implemented in C++ to measure native and JVM processes. It minimizes the profiling overhead by locating the profiler process outside the target process and moving the disk writing overhead off the critical path with buffer blocks and compression threads. Using MooBench, Cloudprofiler's buffered ID handler with the Zstandard lossless data compression ZSTD showed an average execution time of 2.28 microseconds. It is 6.15 times faster than the non-buffered and non-compression handler.
AI Key Findings
Get AI-generated insights about this paper's methodology, results, significance, and more — seven facets brought into focus.
Paper Details
Authors
PDF Preview
Related Papers
No references found for this paper.
Discussion 0