Evaluation of the effectiveness of sonification for time series data exploration
Publication
Metrics
AI Quick Summary
This study investigates the effectiveness of sonification versus visual representation for time series data exploration, finding that while sonification can detect transit-like features above chance, visual plots generally yield better performance, especially for astronomers. The study also reveals that sonification leads to more liberal detection responses compared to visual methods.
Paper Preview
Abstract
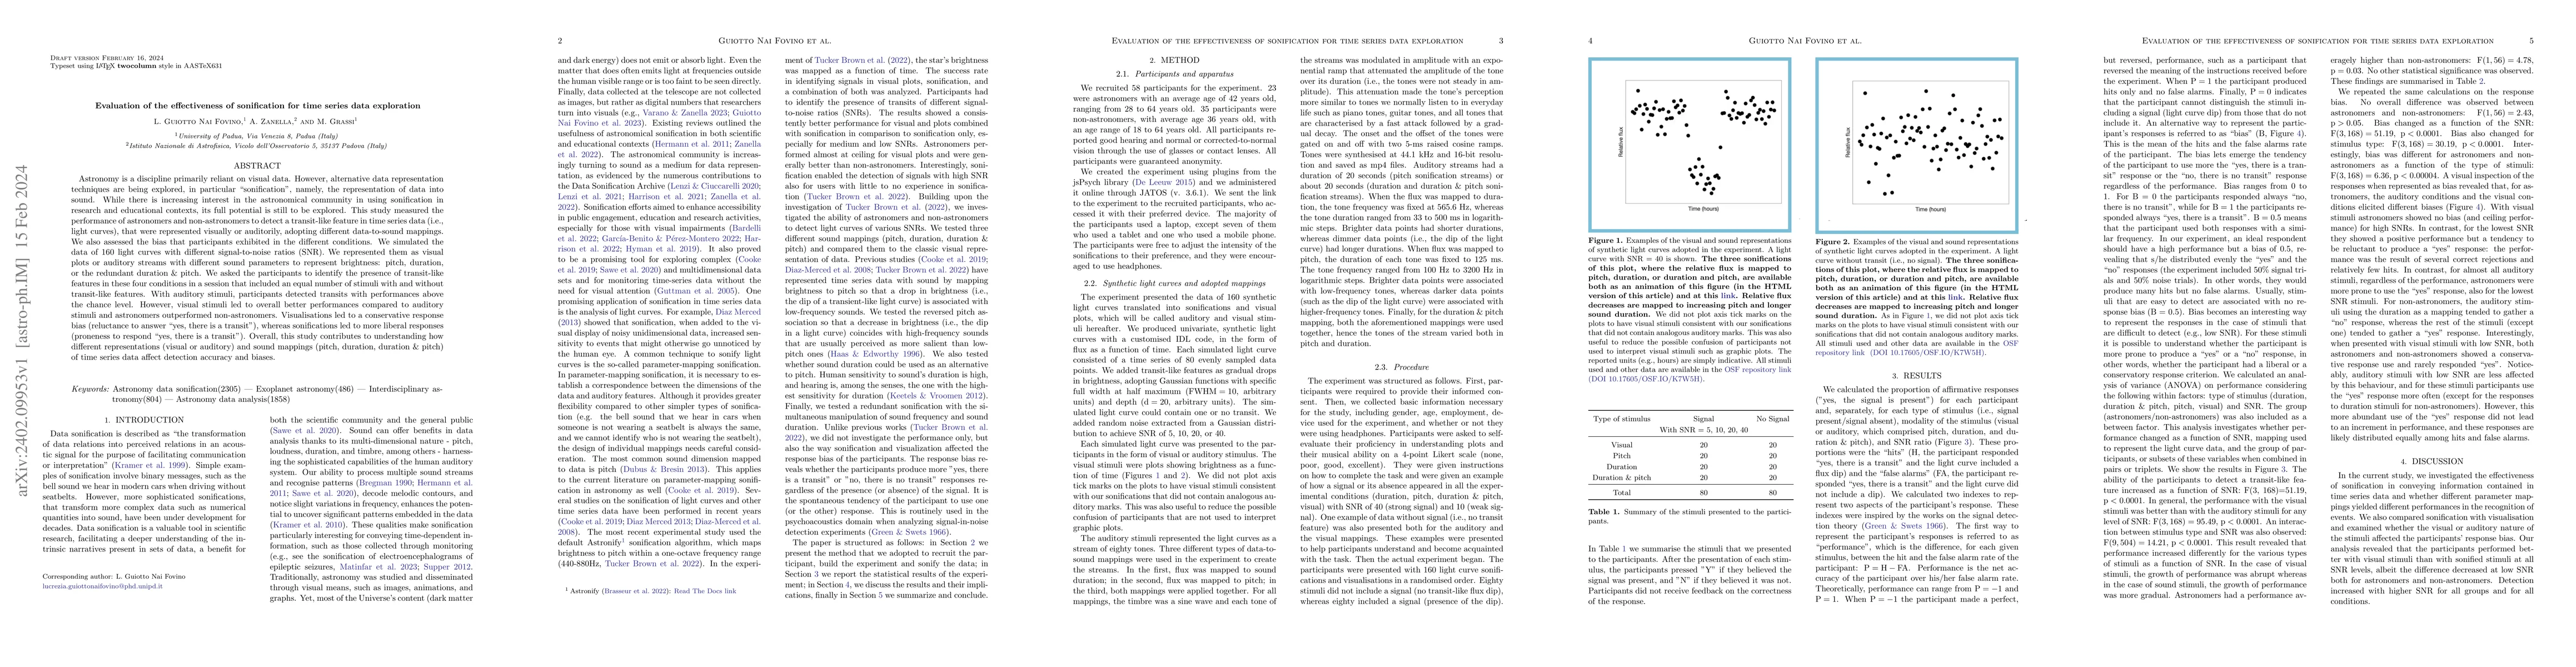
Astronomy is a discipline primarily reliant on visual data. However, alternative data representation techniques are being explored, in particular ''sonification'', namely, the representation of data into sound. While there is increasing interest in the astronomical community in using sonification in research and educational contexts, its full potential is still to be explored. This study measured the performance of astronomers and non-astronomers to detect a transit-like feature in time series data (i.e., light curves), that were represented visually or auditorily, adopting different data-to-sound mappings. We also assessed the bias that participants exhibited in the different conditions. We simulated the data of 160 light curves with different signal-to-noise ratios (SNR). We represented them as visual plots or auditory streams with different sound parameters to represent brightness: pitch, duration, or the redundant duration & pitch. We asked the participants to identify the presence of transit-like features in these four conditions in a session that included an equal number of stimuli with and without transit-like features. With auditory stimuli, participants detected transits with performances above the chance level. However, visual stimuli led to overall better performances compared to auditory stimuli and astronomers outperformed non-astronomers. Visualisations led to a conservative response bias (reluctance to answer ''yes, there is a transit''), whereas sonifications led to more liberal responses (proneness to respond ''yes, there is a transit''). Overall, this study contributes to understanding how different representations (visual or auditory) and sound mappings (pitch, duration, duration & pitch) of time series data affect detection accuracy and biases.
AI Key Findings
Get AI-generated insights about this paper's methodology, results, significance, and more — seven facets brought into focus.
Impact
Paper Details
Authors
PDF Preview
Key Terms
Citation Network
Current paper (gray), citations (green), references (blue)
Display is limited for performance on very large graphs.
Discussion 0