Evaluation of Visualization by Demonstration and Manual View Specification
Publication
Metrics
AI Quick Summary
This study compares two visualization tools with different interaction paradigms, finding that they influence users' approaches to constructing visualizations, goal formation, and control during the process.
Paper Preview
Abstract
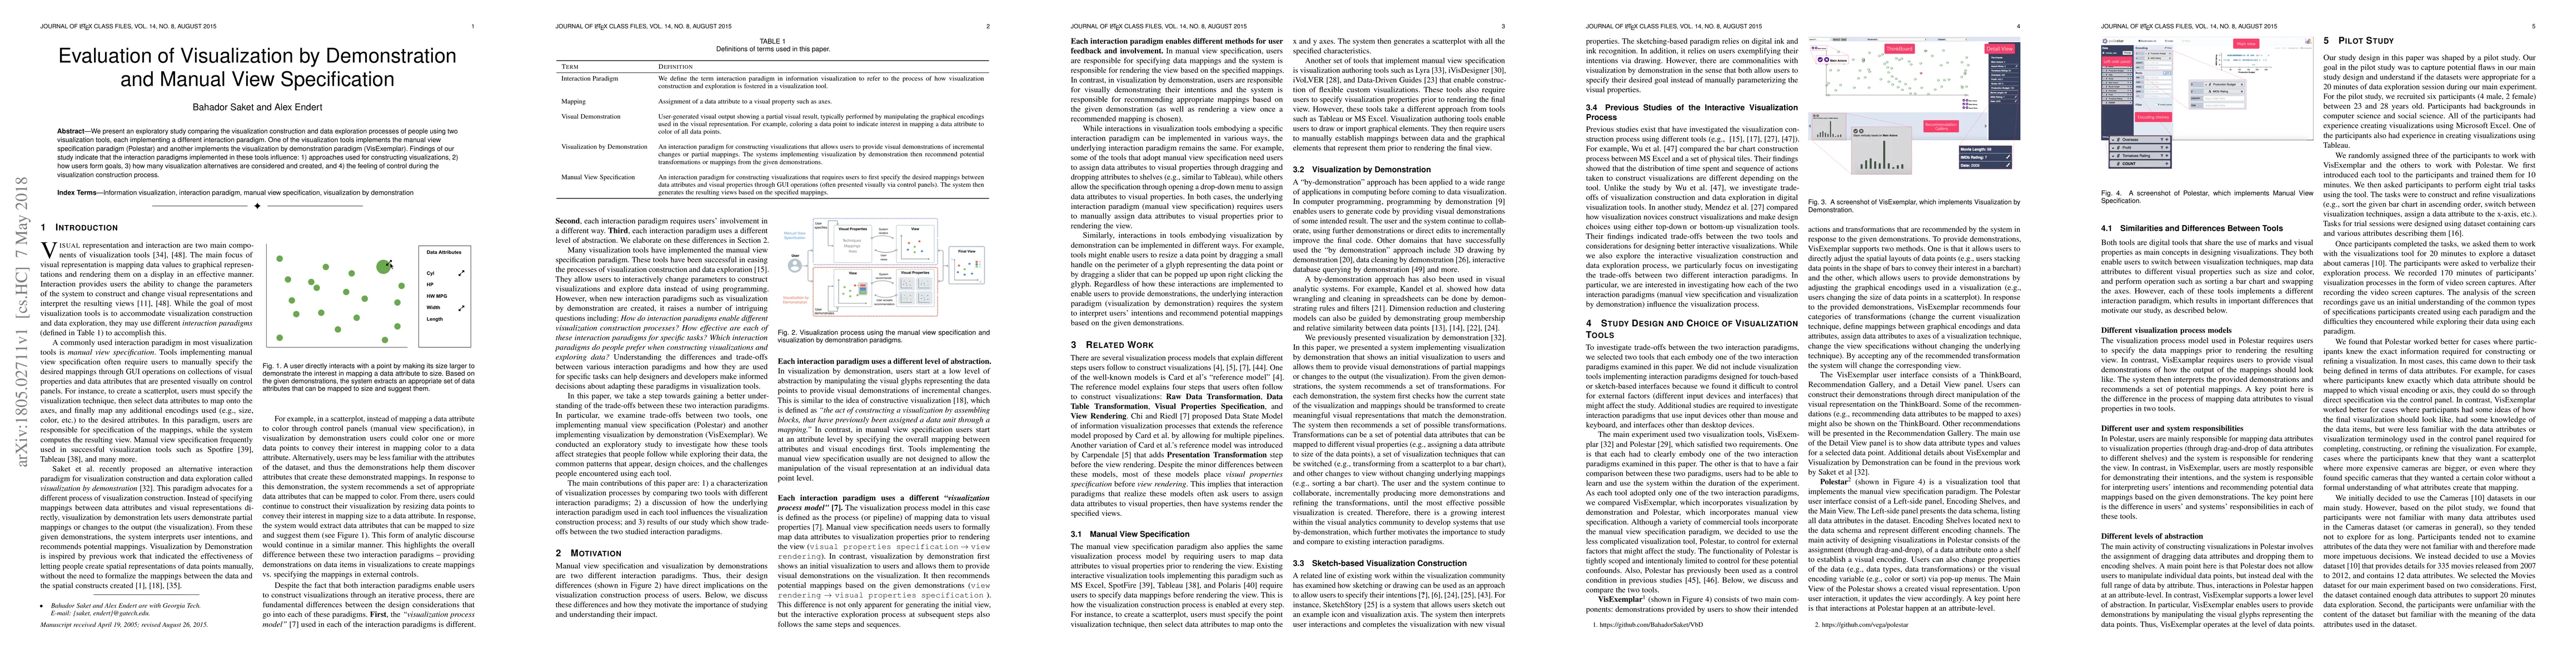
We present an exploratory study comparing the visualization construction and data exploration processes of people using two visualization tools, each implementing a different interaction paradigm. One of the visualization tools implements the manual view specification paradigm (Polestar) and another implements the visualization by demonstration paradigm (VisExemplar). Findings of our study indicate that the interaction paradigms implemented in these tools influence: 1) approaches used for constructing visualizations, 2) how users form goals, 3) how many visualization alternatives are considered and created, and 4) the feeling of control during the visualization construction process.
AI Key Findings
Get AI-generated insights about this paper's methodology, results, significance, and more — seven facets brought into focus.
Impact
Paper Details
PDF Preview
Key Terms
Citation Network
Current paper (gray), citations (green), references (blue)
Display is limited for performance on very large graphs.
Discussion 0