Publication
Metrics
AI Quick Summary
This paper uses N-body simulations to explore the evolution of binary stars in globular clusters with multiple stellar populations, finding that initial spatial distribution differences between first-generation and second-generation stars affect binary disruption and survival rates, with second-generation binaries being more disrupted and surviving binaries showing a higher binding energy in inner cluster regions.
Paper Preview
Abstract
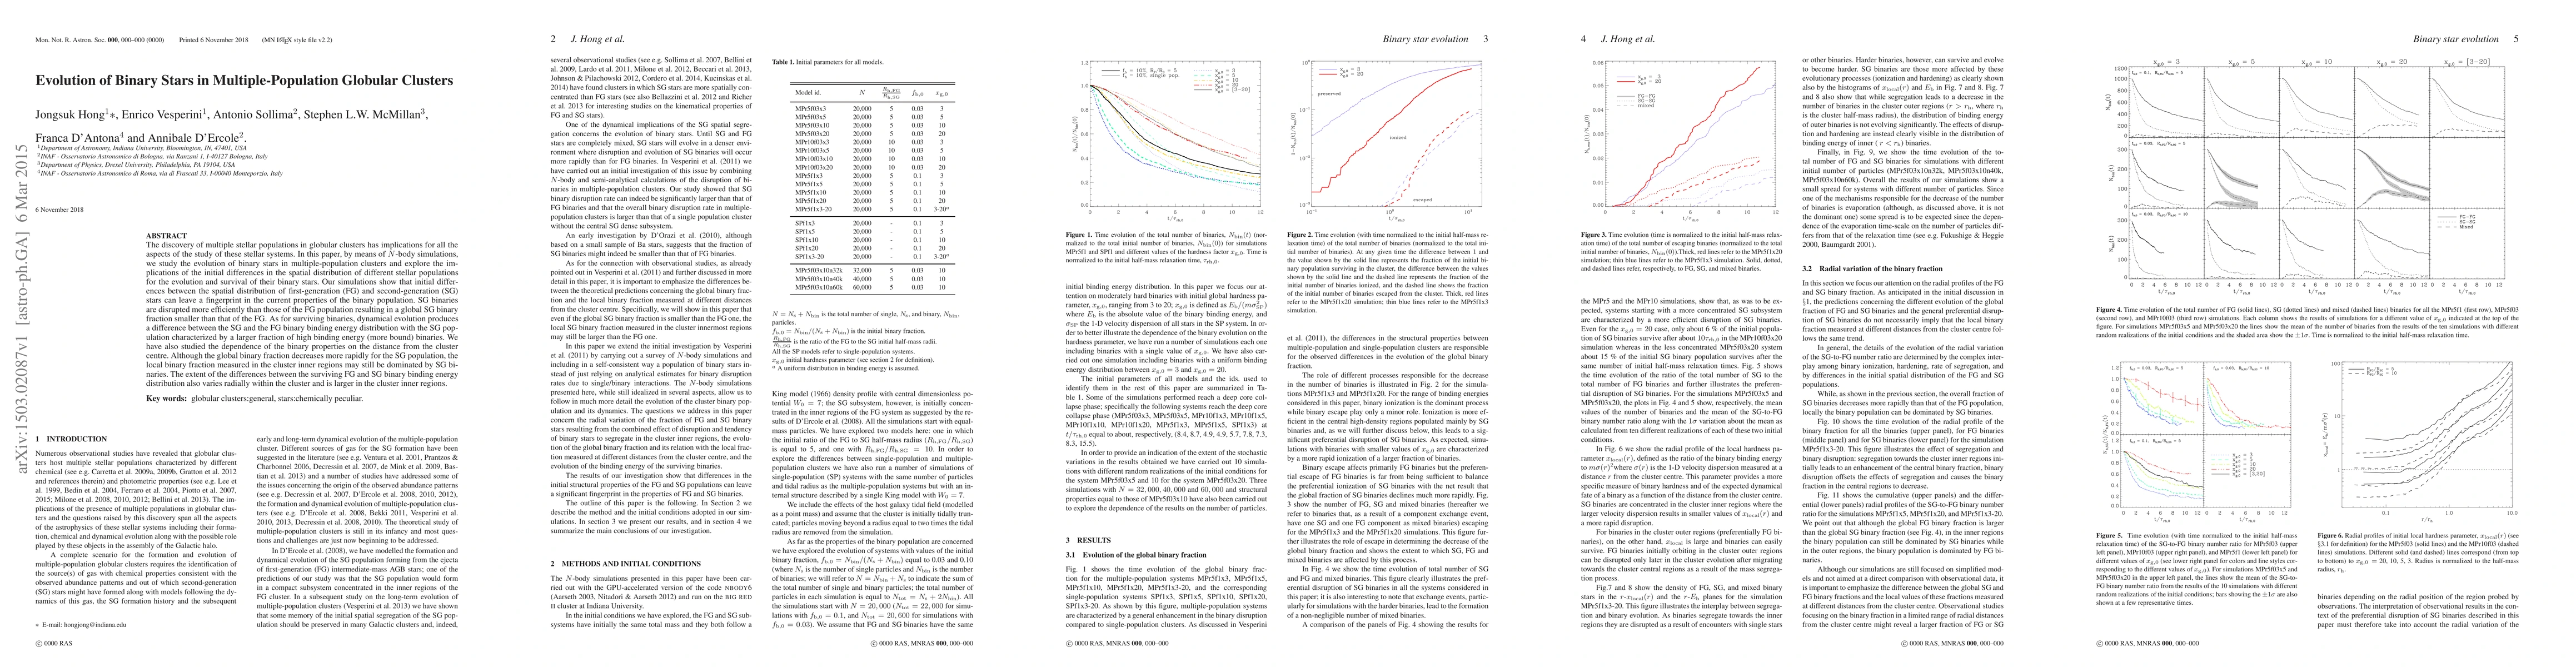
The discovery of multiple stellar populations in globular clusters has implications for all the aspects of the study of these stellar systems. In this paper, by means of N-body simulations, we study the evolution of binary stars in multiple-population clusters and explore the implications of the initial differences in the spatial distribution of different stellar populations for the evolution and survival of their binary stars. Our simulations show that initial differences between the spatial distribution of first-generation (FG) and second-generation (SG) stars can leave a fingerprint in the current properties of the binary population. SG binaries are disrupted more efficiently than those of the FG population resulting in a global SG binary fraction smaller than that of the FG. As for surviving binaries, dynamical evolution produces a difference between the SG and the FG binary binding energy distribution with the SG population characterized by a larger fraction of high binding energy (more bound) binaries. We have also studied the dependence of the binary properties on the distance from the cluster centre. Although the global binary fraction decreases more rapidly for the SG population, the local binary fraction measured in the cluster inner regions may still be dominated by SG binaries. The extent of the differences between the surviving FG and SG binary binding energy distribution also varies radially within the cluster and is larger in the cluster inner regions.
AI Key Findings
Get AI-generated insights about this paper's methodology, results, significance, and more — seven facets brought into focus.
Impact
Paper Details
PDF Preview
Key Terms
Citation Network
Current paper (gray), citations (green), references (blue)
Display is limited for performance on very large graphs.
Discussion 0