01
MethodologyHow they did it
Avida simulation platform used to study evolution of phenotypic traits
This paper explores how genome size evolves in asexual populations, revealing that mutation rate inversely correlates with genome size. Low mutation rates favor insertions, promoting genome expansion and complexity, while high mutation rates lead to genome compression to manage mutational load.
This paper explores how genome size evolves in asexual populations, revealing that mutation rate inversely correlates with genome size. Low mutation rates favor insertions, promoting genome expansion and complexity, while high mutation rates lead to genome compression to manage mutational load.
Avida simulation platform used to study evolution of phenotypic traits More in Methodology →
Evolution of 9 phenotypic traits with increasing point mutation rates — Increase in population fitness over time More in Key Results →
Understanding how mutation rates affect evolution of phenotypic traits and its implications for evolutionary biology More in Significance →
Limited sample size and experimental conditions — Assumptions about the Avida simulation platform and its parameters More in Limitations →
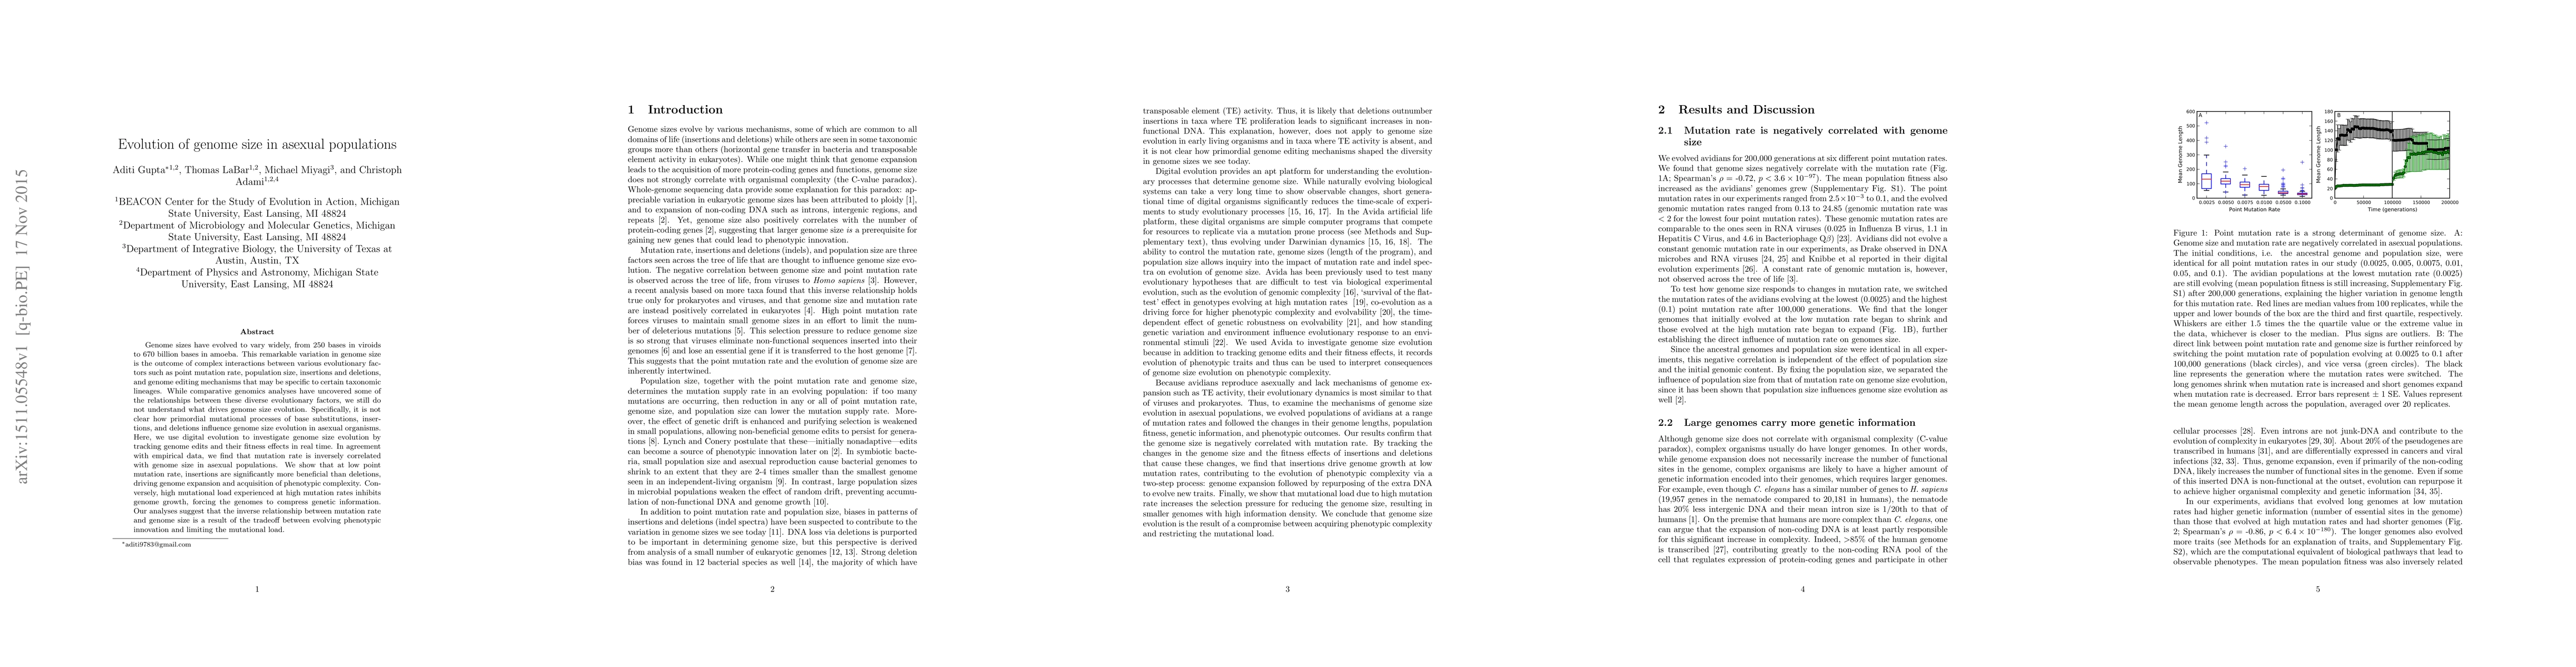
Genome sizes have evolved to vary widely, from 250 bases in viroids to 670 billion bases in amoeba. This remarkable variation in genome size is the outcome of complex interactions between various evolutionary factors such as point mutation rate, population size, insertions and deletions, and genome editing mechanisms that may be specific to certain taxonomic lineages. While comparative genomics analyses have uncovered some of the relationships between these diverse evolutionary factors, we still do not understand what drives genome size evolution. Specifically, it is not clear how primordial mutational processes of base substitutions, insertions, and deletions influence genome size evolution in asexual organisms. Here, we use digital evolution to investigate genome size evolution by tracking genome edits and their fitness effects in real time. In agreement with empirical data, we find that mutation rate is inversely correlated with genome size in asexual populations. We show that at low point mutation rate, insertions are significantly more beneficial than deletions, driving genome expansion and acquisition of phenotypic complexity. Conversely, high mutational load experienced at high mutation rates inhibits genome growth, forcing the genomes to compress genetic information. Our analyses suggest that the inverse relationship between mutation rate and genome size is a result of the tradeoff between evolving phenotypic innovation and limiting the mutational load.
Seven facets of this paper, analysed and brought into focus by AI.
Understanding how mutation rates affect evolution of phenotypic traits and its implications for evolutionary biology
Avida simulation platform used to study evolution of phenotypic traits
Understanding how mutation rates affect evolution of phenotypic traits and its implications for evolutionary biology
Development of a new understanding of how point mutation rates affect evolutionary outcomes in Avida simulations
The use of Avida simulations to study the effects of point mutation rates on phenotypic trait evolution and its implications for evolutionary biology
Current paper (gray), citations (green), references (blue)
Display is limited for performance on very large graphs.
Discussion 0