Authors
Summary
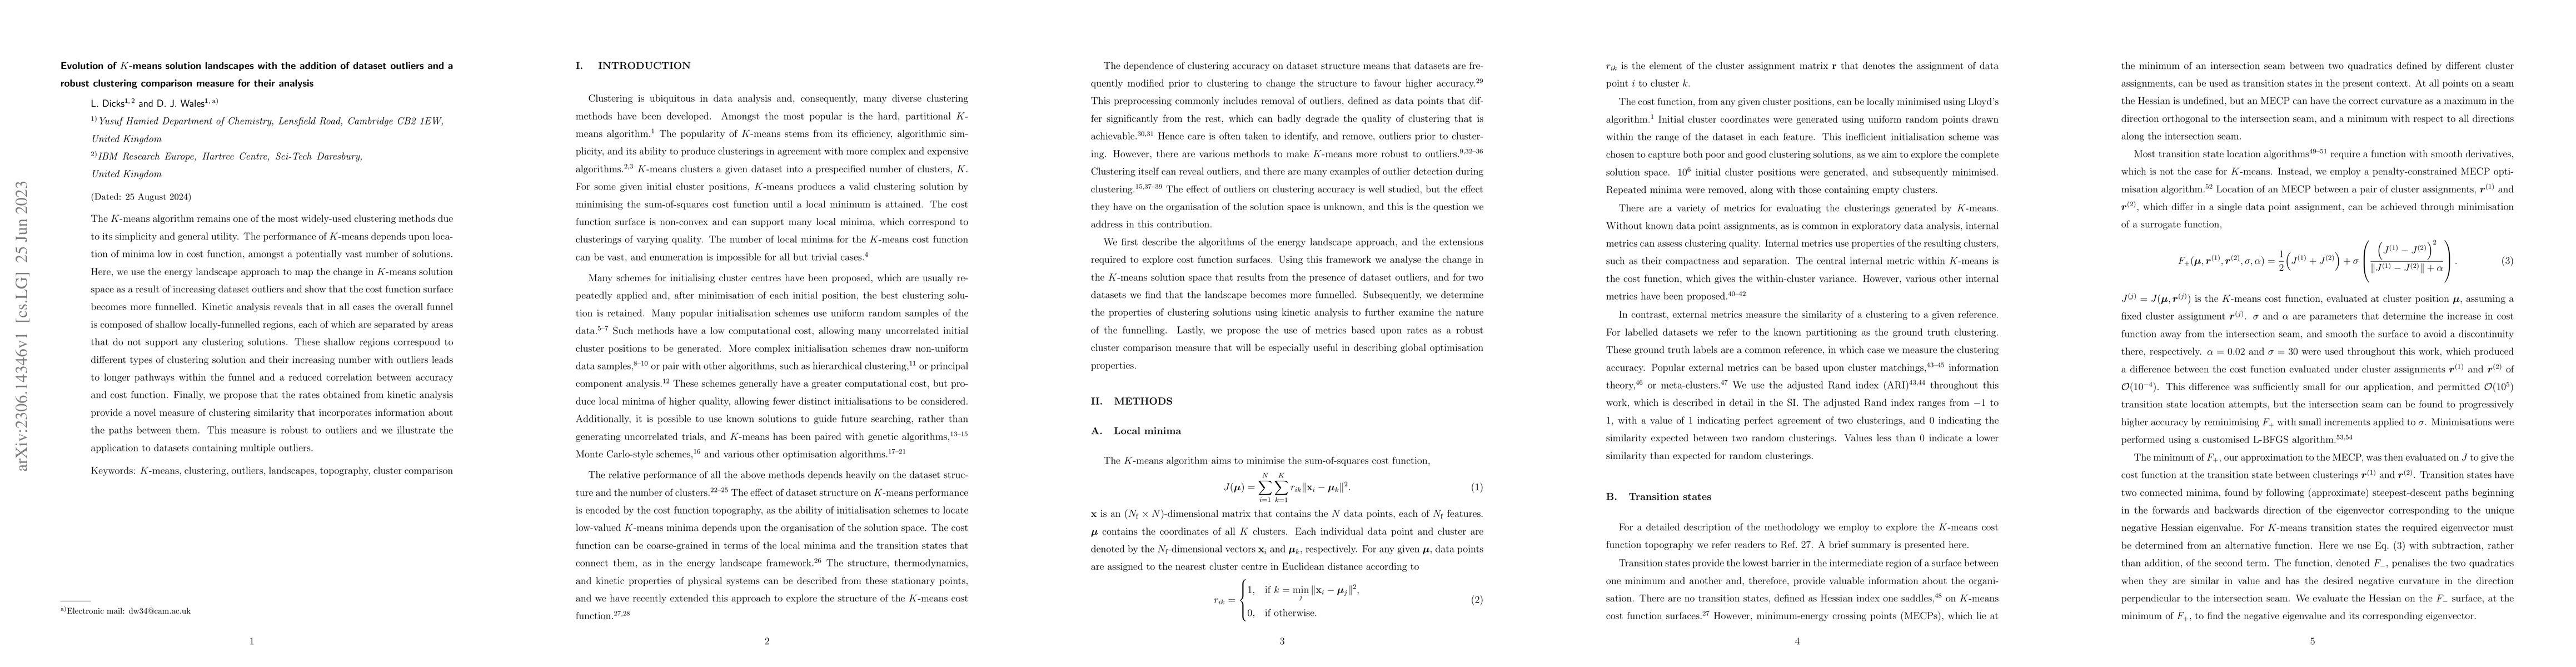
The $K$-means algorithm remains one of the most widely-used clustering methods due to its simplicity and general utility. The performance of $K$-means depends upon location of minima low in cost function, amongst a potentially vast number of solutions. Here, we use the energy landscape approach to map the change in $K$-means solution space as a result of increasing dataset outliers and show that the cost function surface becomes more funnelled. Kinetic analysis reveals that in all cases the overall funnel is composed of shallow locally-funnelled regions, each of which are separated by areas that do not support any clustering solutions. These shallow regions correspond to different types of clustering solution and their increasing number with outliers leads to longer pathways within the funnel and a reduced correlation between accuracy and cost function. Finally, we propose that the rates obtained from kinetic analysis provide a novel measure of clustering similarity that incorporates information about the paths between them. This measure is robust to outliers and we illustrate the application to datasets containing multiple outliers.
AI Key Findings
Get AI-generated insights about this paper's methodology, results, and significance.
Paper Details
PDF Preview
Key Terms
Citation Network
Current paper (gray), citations (green), references (blue)
Display is limited for performance on very large graphs.
Similar Papers
Found 4 papersAdaptively Robust and Sparse K-means Clustering
Hao Li, Shonosuke Sugasawa, Shota Katayama
Distributed k-Means with Outliers in General Metrics
Andrea Pietracaprina, Geppino Pucci, Enrico Dandolo
| Title | Authors | Year | Actions |
|---|
Comments (0)