Authors
Summary
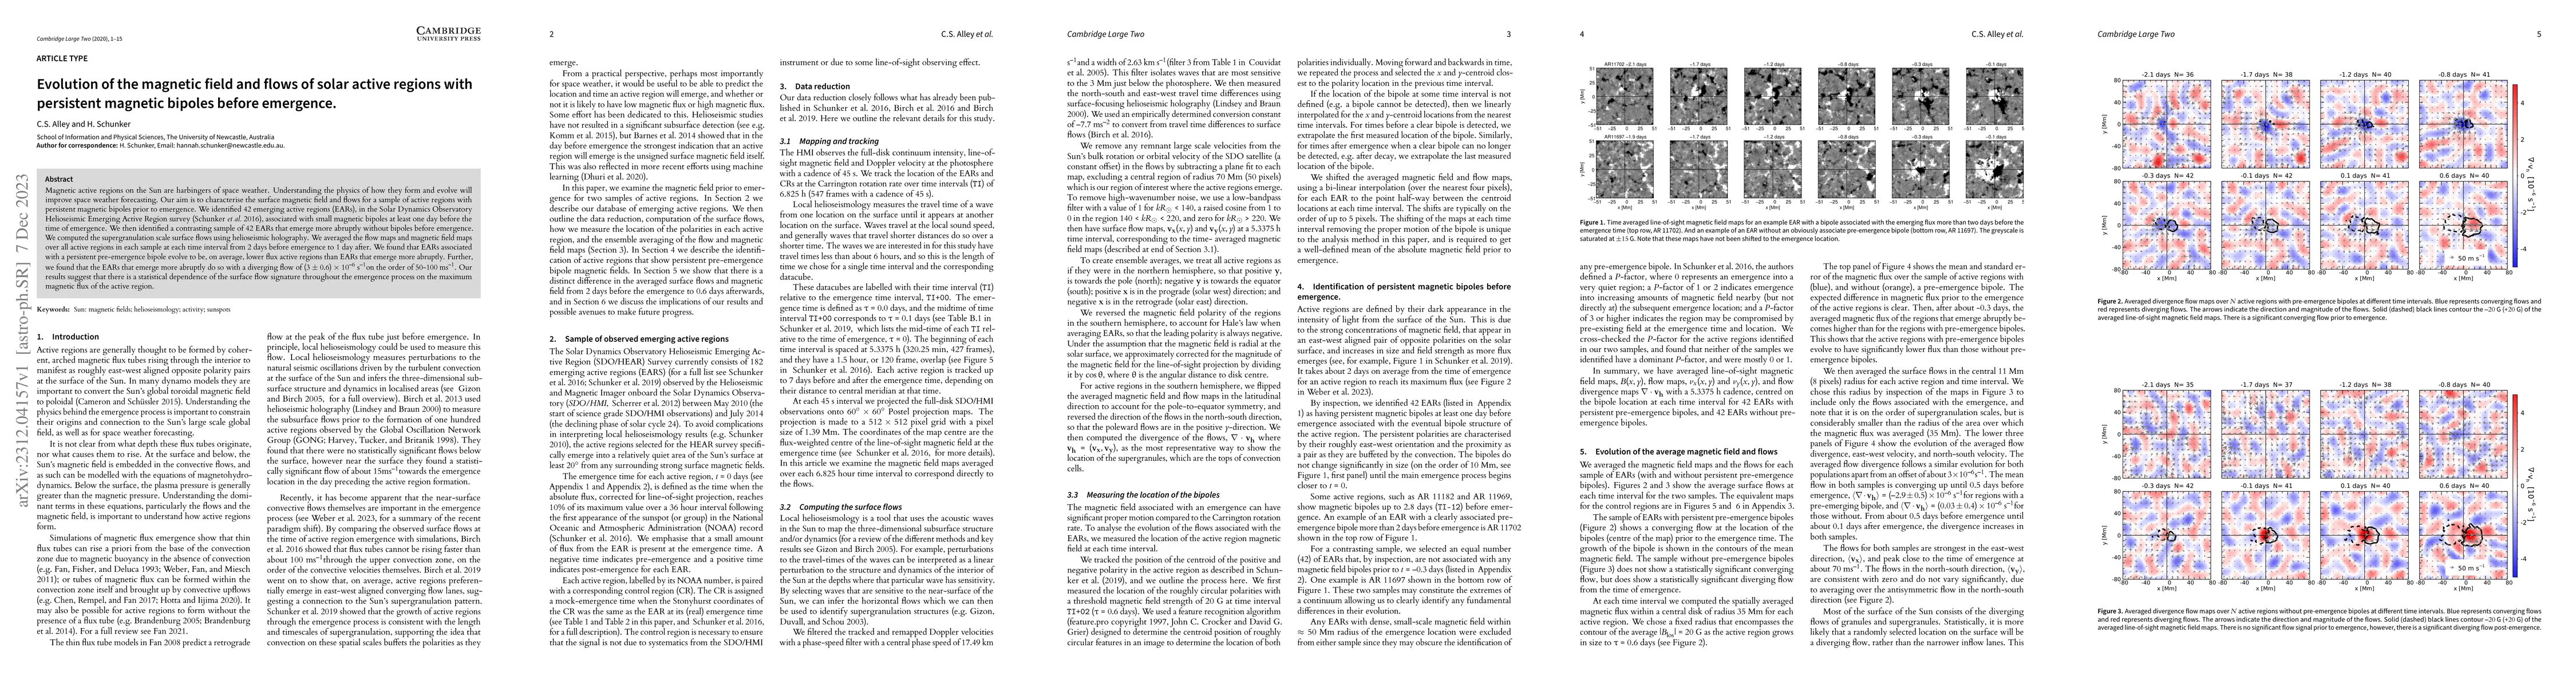
Magnetic active regions on the Sun are harbingers of space weather events. Understanding the physics of how they form and evolve will improve space weather forecasting. Our aim is to characterise the surface magnetic field and flows for a sample of active regions with persistent magnetic bipoles prior to emergence. We identified 42 emerging active regions (EARs), in the Solar Dynamics Observatory Helioseismic Emerging Active Region survey (Schunker et al. 2016), associated with small magnetic bipoles at least one day before the time of emergence. We then identified a contrasting sample of 42 EARs that emerge more abruptly without bipoles before emergence. We computed the supergranulation scale surface flows using helioseismic holography. We averaged the flow maps and magnetic field maps over all active regions in each sample at each time interval from 2 days before emergence to 1 day after. We found that EARs associated with a persistent pre-emergence bipole evolve to be, on average, lower flux active regions than EARs that emerge more abruptly. Further, we found that the EARs that emerge more abruptly do so with a diverging flow of $(3\pm 0.6) \times 10^{-6}$ s$^{-1}$ on the order of 50-100 ms$^{-1}$. Our results suggest that there is a statistical dependence of the surface flow signature throughout the emergence process on the maximum magnetic flux of the active region.
AI Key Findings
Get AI-generated insights about this paper's methodology, results, and significance.
Paper Details
PDF Preview
Key Terms
Citation Network
Current paper (gray), citations (green), references (blue)
Display is limited for performance on very large graphs.
Similar Papers
Found 4 papersMagnetic evolution of complex solar active regions
Thomas Hackman, Shabnam Nikbakhsh, Eija I. Tanskanen
No citations found for this paper.
Comments (0)