Summary
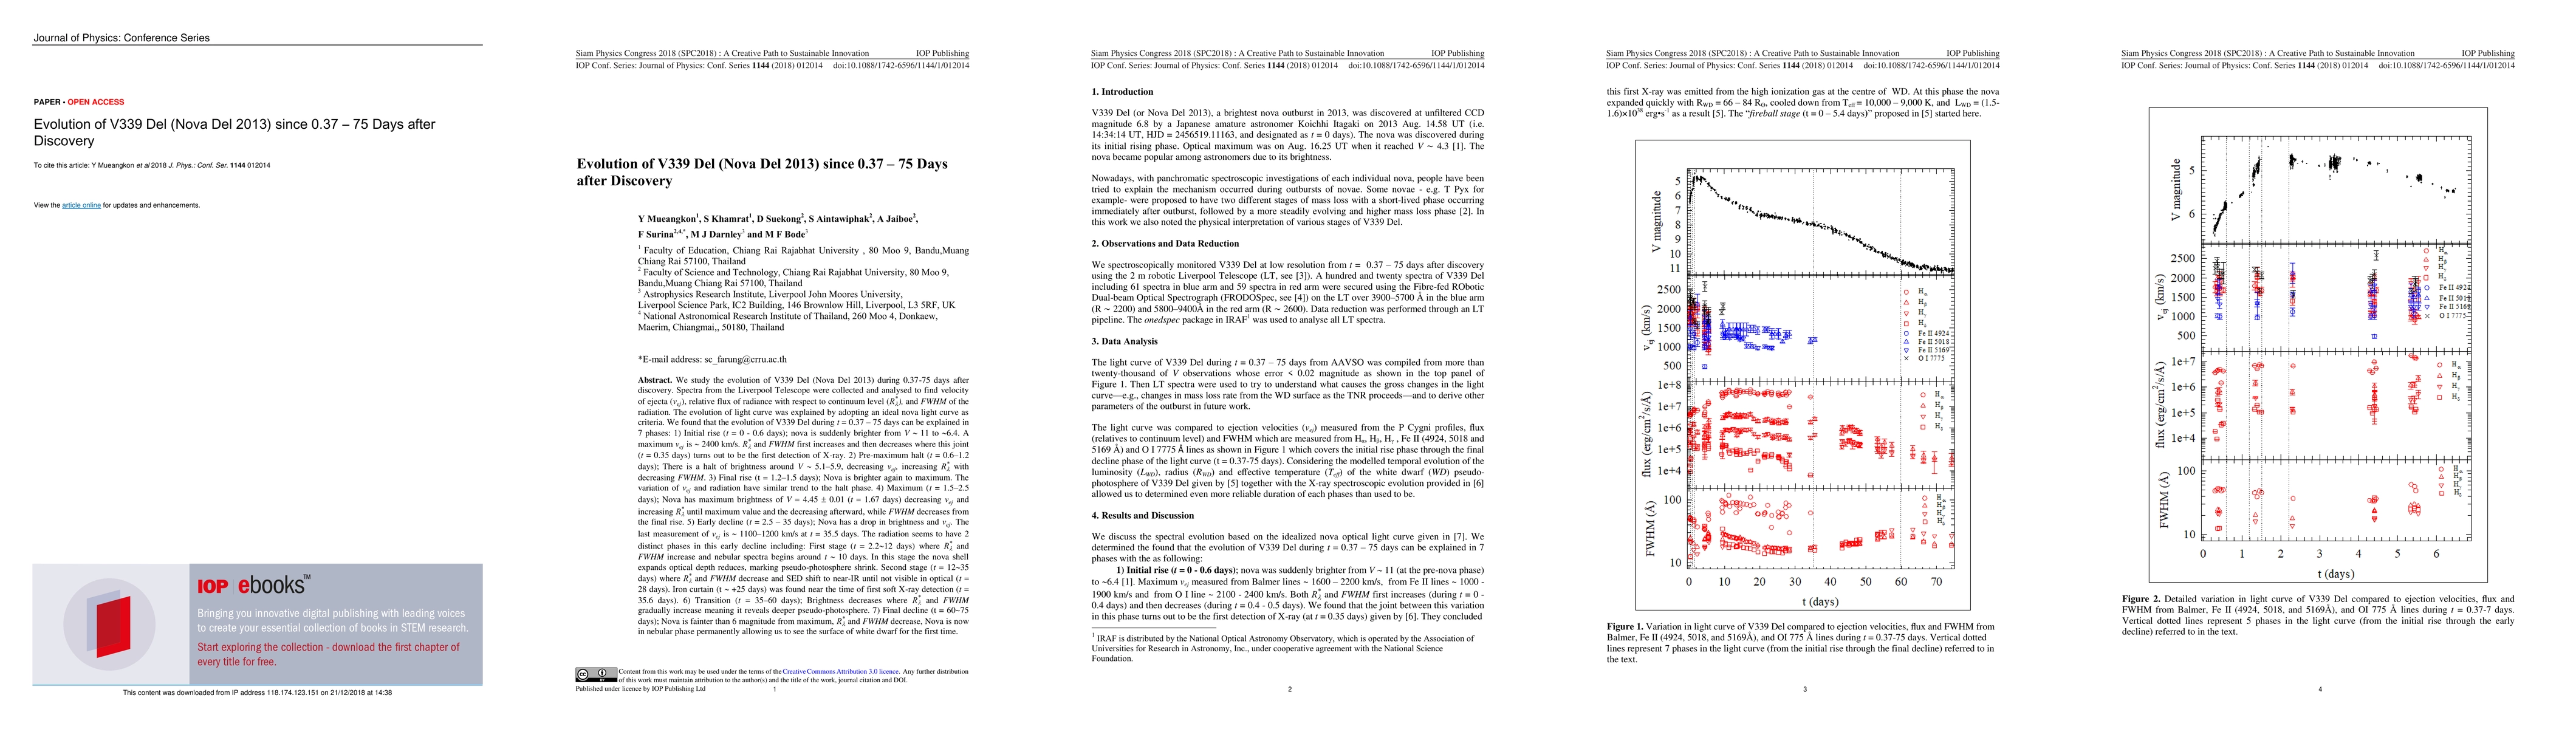
We study the evolution of V339 Del (Nova Del 2013) during 0.37 to 75 days after discovery. Spectra from the Liverpool Telescope were collected and analysed to find velocity of ejecta, relative radiation with respect to continuum level, and FWHM of the radiation. The evolution of light curve was explained by adopting an ideal nova light curve as criteria. We found that the evolution of V339 Del during t = 0.37 to 75 days can be explained in 7 phases: 1) Initial rise (t = 0 - 0.6 days, 2) Pre-maximum halt (t = 0.6 to 1.2 days), 3) Final rise (t = 1.2 to 1.5 days), 4) Maximum (t = 1.5 to 2.5 days), 5) Early decline (t = 2.5 to 35 days), 6) Transition (t = 35 to 60 days), and 7) Final decline (t = 60 to approximately 75 days).
AI Key Findings
Get AI-generated insights about this paper's methodology, results, and significance.
Paper Details
PDF Preview
Key Terms
Citation Network
Current paper (gray), citations (green), references (blue)
Display is limited for performance on very large graphs.
| Title | Authors | Year | Actions |
|---|
Comments (0)