A new visualization tool called eXamine has been developed to help researchers interpret biological networks with annotated modules, allowing for easier exploration of both network structure and annotations.
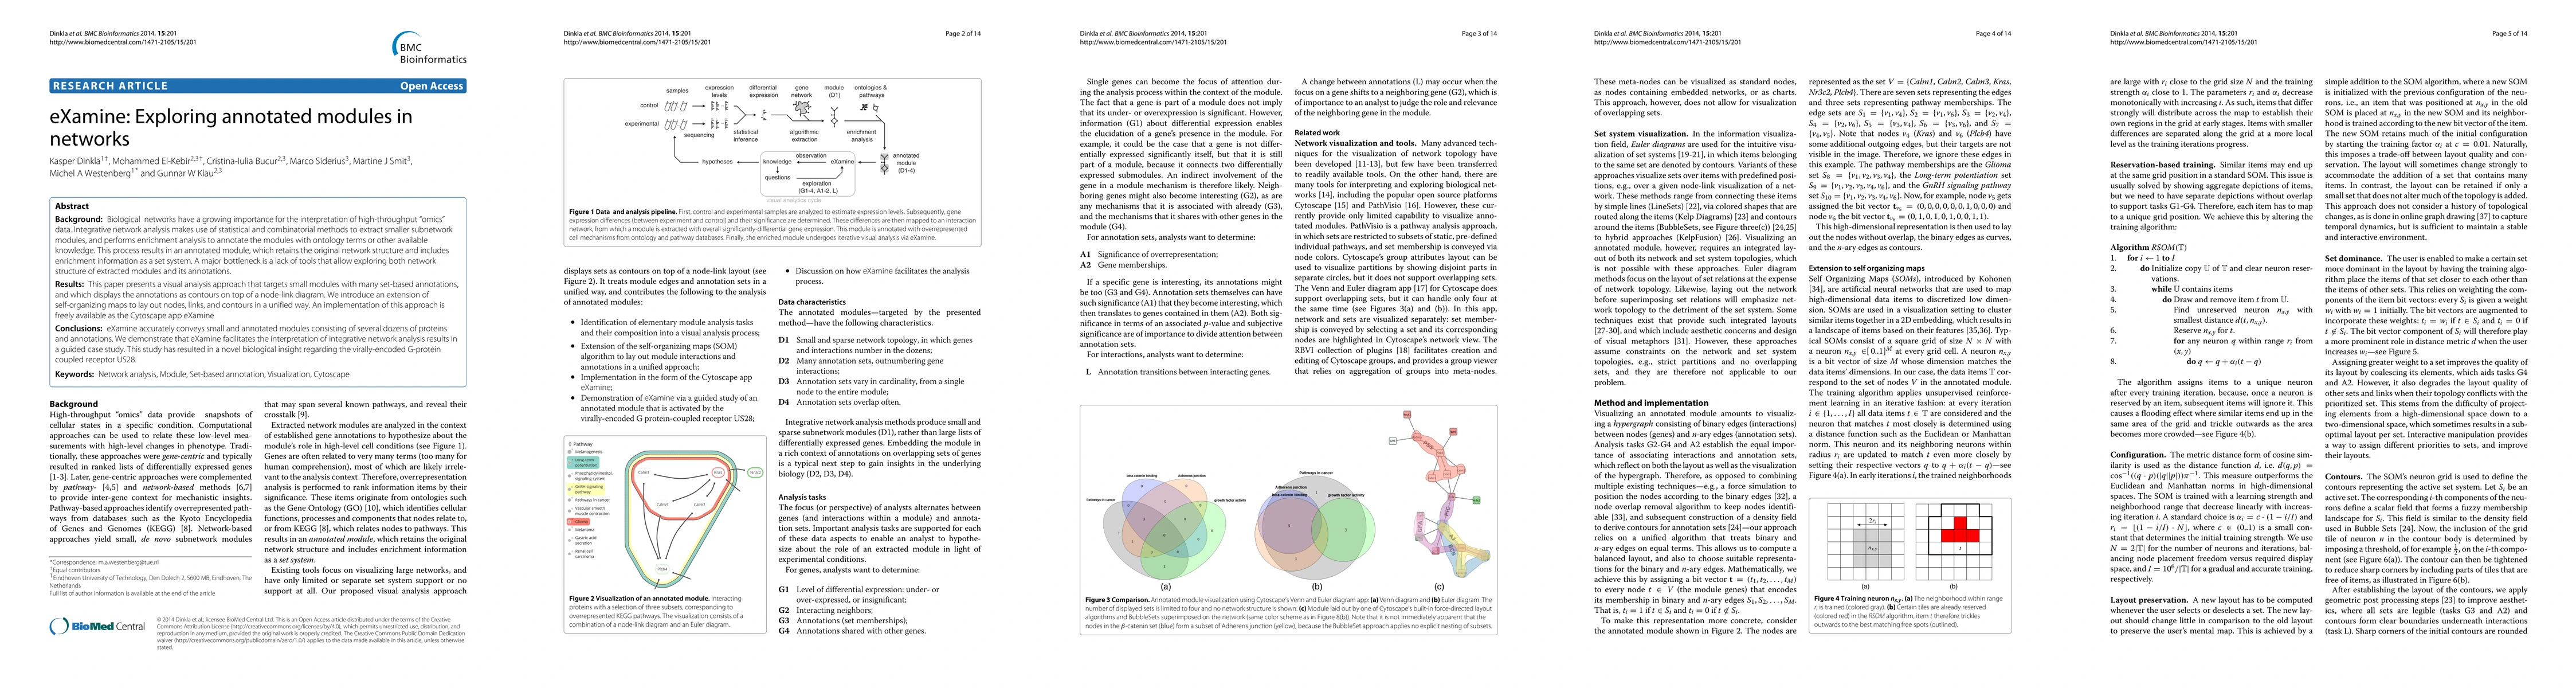
Background: Biological networks have a growing importance for the interpretation of high-throughput omics data. Integrative network analysis makes use of statistical and combinatorial methods to extract smaller subnetwork modules, and performs enrichment analysis to annotate the modules with ontology terms or other available knowledge. This process results in an annotated module, which retains the original network structure and includes enrichment information as a set system. A major bottleneck is a lack of tools that allow exploring both network structure of extracted modules and its annotations. Results: Thispaperpresentsavisualanalysisapproachthattargetssmallmoduleswithmanyset-based annotations, and which displays the annotations as contours on top of a node-link diagram. We introduce an extension of self-organizing maps to lay out nodes, links, and contours in a unified way. An implementation of this approach is freely available as the Cytoscape app eXamine. Conclusions: eXamine accurately conveys small and annotated modules consisting of several dozens of proteins and annotations. We demonstrate that eXamine facilitates the interpretation of integrative network analysis results in a guided case study. This study has resulted in a novel biological insight regarding the virally-encoded G-protein coupled receptor US28.
Get AI-generated insights about this paper's methodology, results, and significance.
Current paper (gray), citations (green), references (blue)
Title | Authors | Year | Actions |
---|---|---|---|
A virally encoded GPCR drives glioblastoma through feed-forward activation of the SK1-S1P1 signaling axis
|
N. Bergkamp, Jeffrey R. van Senten, H. J. Brink, Maarten P. Bebelman, Jelle van den Bor, Tuğçe S. Çobanoğlu, K. Dinkla, Johannes Köster, G. Klau, M. Siderius, M. Smit
|
2023
|
View Paper |
Excessive Neutrophils and Neutrophil Extracellular Traps in COVID-19
|
Jun Wang, Qian Li, Yongmei Yin, Yingying Zhang, Yingying Cao, Xiaomin Lin, Lihua Huang, D. Hoffmann, Mengji Lu, Yuanwang Qiu
|
2020
|
View Paper |
Optimizing Stepwise Animation in Dynamic Set Diagrams
|
Kazuyo Mizuno, Hsiang-Yun Wu, Shigeo Takahashi, T. Igarashi
|
2019
|
View Paper |
Clustering approaches for visual knowledge exploration in molecular interaction networks
|
M. Ostaszewski, Emmanuel Kieffer, Grégoire Danoy, Reinhard Schneider, P. Bouvry
|
2018
|
View Paper |
Short Plane Supports for Spatial Hypergraphs
|
Thom Castermans, M. V. Garderen, Wouter Meulemans, M. Nöllenburg, Xiaoru Yuan
|
2018
|
View Paper |
eXamine: Visualizing annotated networks in Cytoscape
|
Philipp Spohr, K. Dinkla, G. Klau, M. El-Kebir
|
2018
|
View Paper |
Trajectory analysis : bridging algorithms and visualization
|
M. Konzack
|
2018
|
View Paper |
Dynamic Influence Networks for Rule-Based Models
|
A. Forbes, A. Burks, Kristine Lee, Xing Li, Pierre Boutillier, J. Krivine, W. Fontana
|
2017
|
View Paper |
Visualizing Group Structures in Graphs: A Survey
|
Corinna Vehlow, Fabian Beck, D. Weiskopf
|
2017
|
View Paper |
Integrating Candida albicans metabolism with biofilm heterogeneity by transcriptome mapping
|
R. Rajendran, A. May, L. Sherry, Ryan Kean, Craig Williams, B. Jones, Karl E. V. Burgess, J. Heringa, Sanne Abeln, B. Brandt, C. Munro, G. Ramage
|
2016
|
View Paper |
Interactive and Iterative Discovery of Entity Network Subgraphs
|
Hao Wu, Maoyuan Sun, Jilles Vreeken, Nikolaj Tatti, Chris North, Naren Ramakrishnan
|
2016
|
View Paper |
An NMF-L2,1-Norm Constraint Method for Characteristic Gene Selection
|
Dong Wang, Jin-Xing Liu, Ying-Lian Gao, Jiguo Yu, C. Zheng, Yong Xu
|
2016
|
View Paper |
metaModules identifies key functional subnetworks in microbiome-related disease
|
A. May, B. Brandt, M. El-Kebir, G. Klau, E. Zaura, W. Crielaard, J. Heringa, Sanne Abeln
|
2016
|
View Paper |
The State‐of‐the‐Art of Set Visualization
|
B. Alsallakh, L. Micallef, W. Aigner, H. Hauser, S. Miksch, P. Rodgers
|
2016
|
View Paper |
Visualizing Sets with Linear Diagrams
|
P. Rodgers, Gem Stapleton, P. Chapman
|
2015
|
View Paper |
Networks, modules and breeding schedules: Applications of Combinatorial Optimization to Computational Biology
|
M. El-Kebir
|
2015
|
View Paper |
Oncogenic properties and targeting of chemokine receptors CXCR4, CXCR7 and US28
|
Azra Mujić-Delić, Aissam Errami, Mansi Shah
|
2015
|
View Paper |
Imagining Macondo: Interacting with García Márquez's Literary Landscape
|
A. Forbes, A. E. B. Valdes, Paul Murray, G. Legrady
|
2015
|
View Paper |
Application of Graph Regularized Non-negative Matrix Factorization in Characteristic Gene Selection
|
Dong Wang, Ying-Lian Gao, Jin-Xing Liu, Jiguo Yu, Chang-Gang Wen
|
2015
|
View Paper |
Extended LineSets: a visualization technique for the interactive inspection of biological pathways
|
F. Paduano, A. Forbes
|
2015
|
View Paper |
Visual analysis of biological data-knowledge networks
|
Corinna Vehlow, D. Kao, M. Bristow, L. Hunter, D. Weiskopf, C. Görg
|
2015
|
View Paper |
Visualizing Group Structure in Compound Graphs: The Current State, Lessons Learned, and Outstanding Opportunities
|
H. Ehlers, Diana Marin, Hsiang-Yun Wu, R. Raidou
|
2024
|
View Paper |
Identifying functional modules in Arabidopsis thaliana root development
|
Felix S. Grünewald
|
2018
|
View Paper |
Making sense of our microbes as they become data in our computers
|
A. May
|
2017
|
View Paper |
Title Dynamic Influence Networks for Rule-based Models Permalink
|
Ag, Burks
|
2017
|
View Paper |
Networks to the Rescue - From Big "Omics" Data to Targeted Hypotheses
|
G. Klau
|
2016
|
View Paper |
Visualization of modular structures in biological networks
|
K. Dinkla
|
2015
|
View Paper |
The State of the Art in Visualizing Group Structures in Graphs
|
Corinna Vehlow, Fabian Beck, D. Weiskopf
|
2015
|
View Paper |
French German Hungarian Italian Spanish Turkish Welsh
|
Peter Chapman
|
View Paper |
Comments (0)