Summary
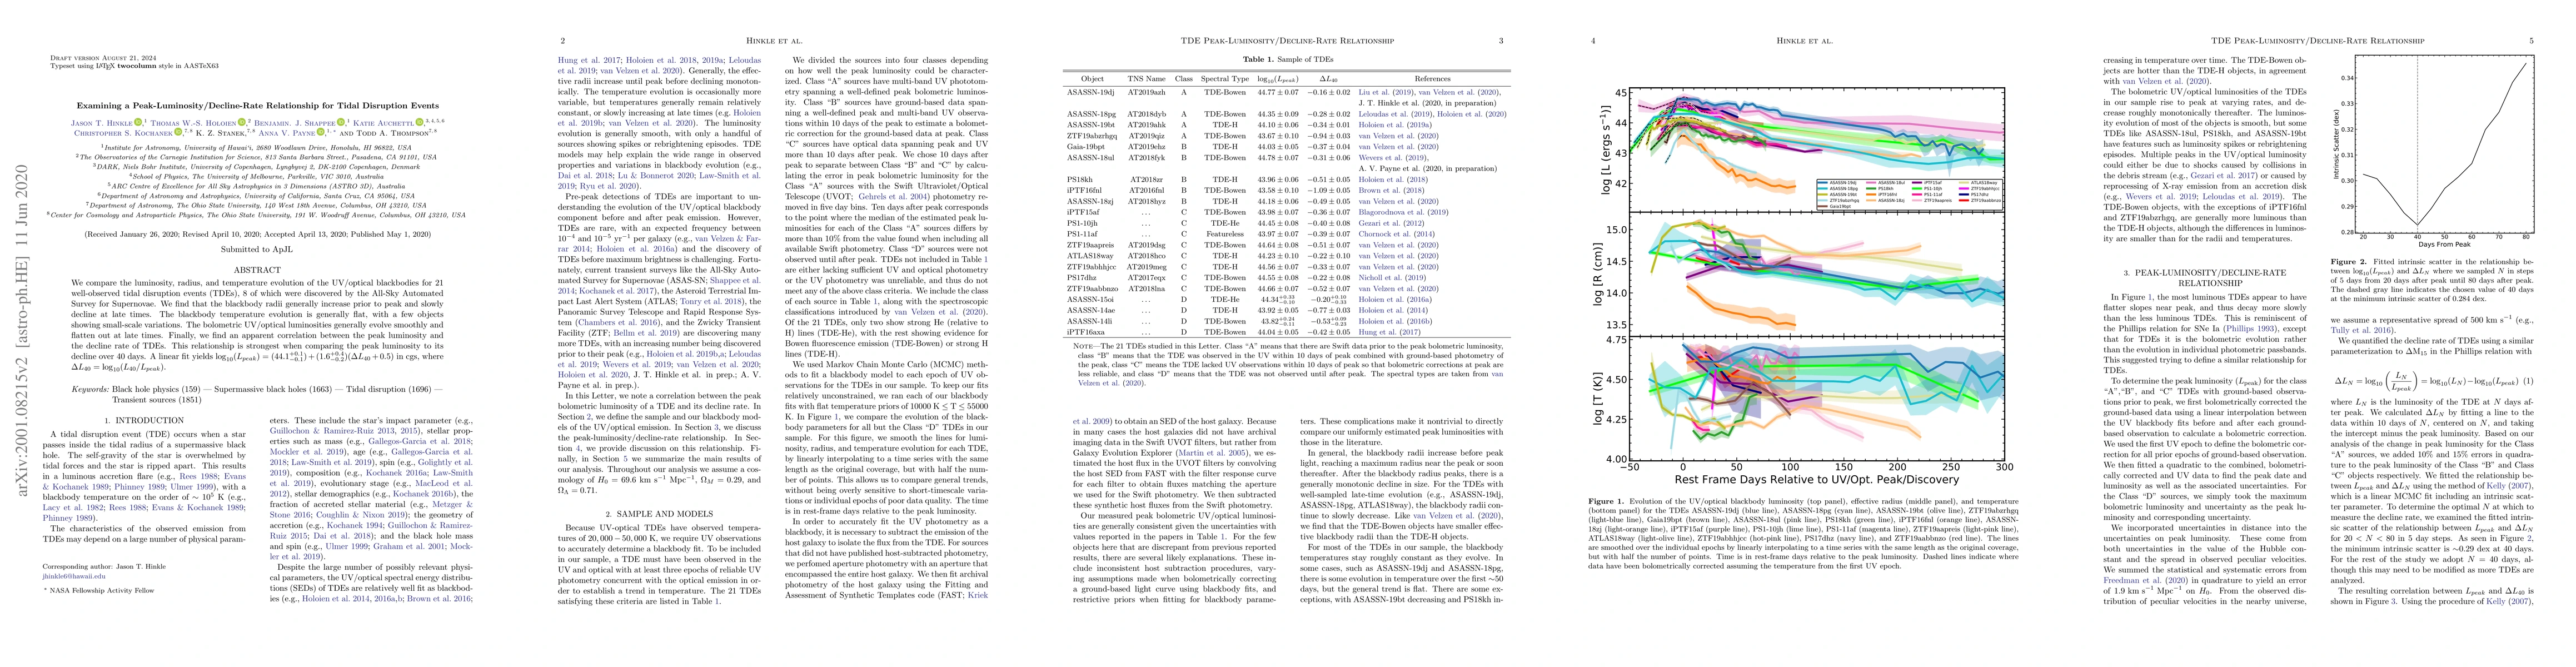
We compare the luminosity, radius, and temperature evolution of the UV/optical blackbodies for 21 well-observed tidal disruption events (TDEs), 8 of which were discovered by the All-Sky Automated Survey for Supernovae. We find that the blackbody radii generally increase prior to peak and slowly decline at late times. The blackbody temperature evolution is generally flat, with a few objects showing small-scale variations. The bolometric UV/optical luminosities generally evolve smoothly and flatten out at late times. Finally, we find an apparent correlation between the peak luminosity and the decline rate of TDEs. This relationship is strongest when comparing the peak luminosity to its decline over 40 days. A linear fit yields $\log_{10}( L_{peak}) = (44.1^{+0.1}_{-0.1}) + (1.6^{+0.4}_{-0.2})(\Delta L_{40} + 0.5)$ in cgs, where $\Delta L_{40} = \log_{10}(L_{40} / L_{peak})$.
AI Key Findings
Get AI-generated insights about this paper's methodology, results, and significance.
Paper Details
PDF Preview
Key Terms
Citation Network
Current paper (gray), citations (green), references (blue)
Display is limited for performance on very large graphs.
Similar Papers
Found 4 papersPre-peak Emission in Tidal Disruption Events
Xiaoshan Huang, Shane W. Davis, Yan-fei Jiang
A simple and accurate prescription for the tidal disruption radius of a star and the peak accretion rate in tidal disruption events
Eric R. Coughlin, Chris Nixon
Revisit the rate of tidal disruption events: the role of the partial tidal disruption event
Shuo Li, Peter Berczik, Rainer Spurzem et al.
The Peak of the Fallback Rate from Tidal Disruption Events: Dependence on Stellar Type
Ananya Bandopadhyay, Eric R. Coughlin, C. J. Nixon et al.
| Title | Authors | Year | Actions |
|---|
Comments (0)