Publication
Metrics
AI Quick Summary
The site frequency spectrum quantifies variation in DNA sequences, with each entry representing the count of mutant alleles present in different frequencies. Under neutral conditions, adding more sequences increases the spectrum's final entry without altering existing entries, a behavior explained in this note.
Paper Preview
Abstract
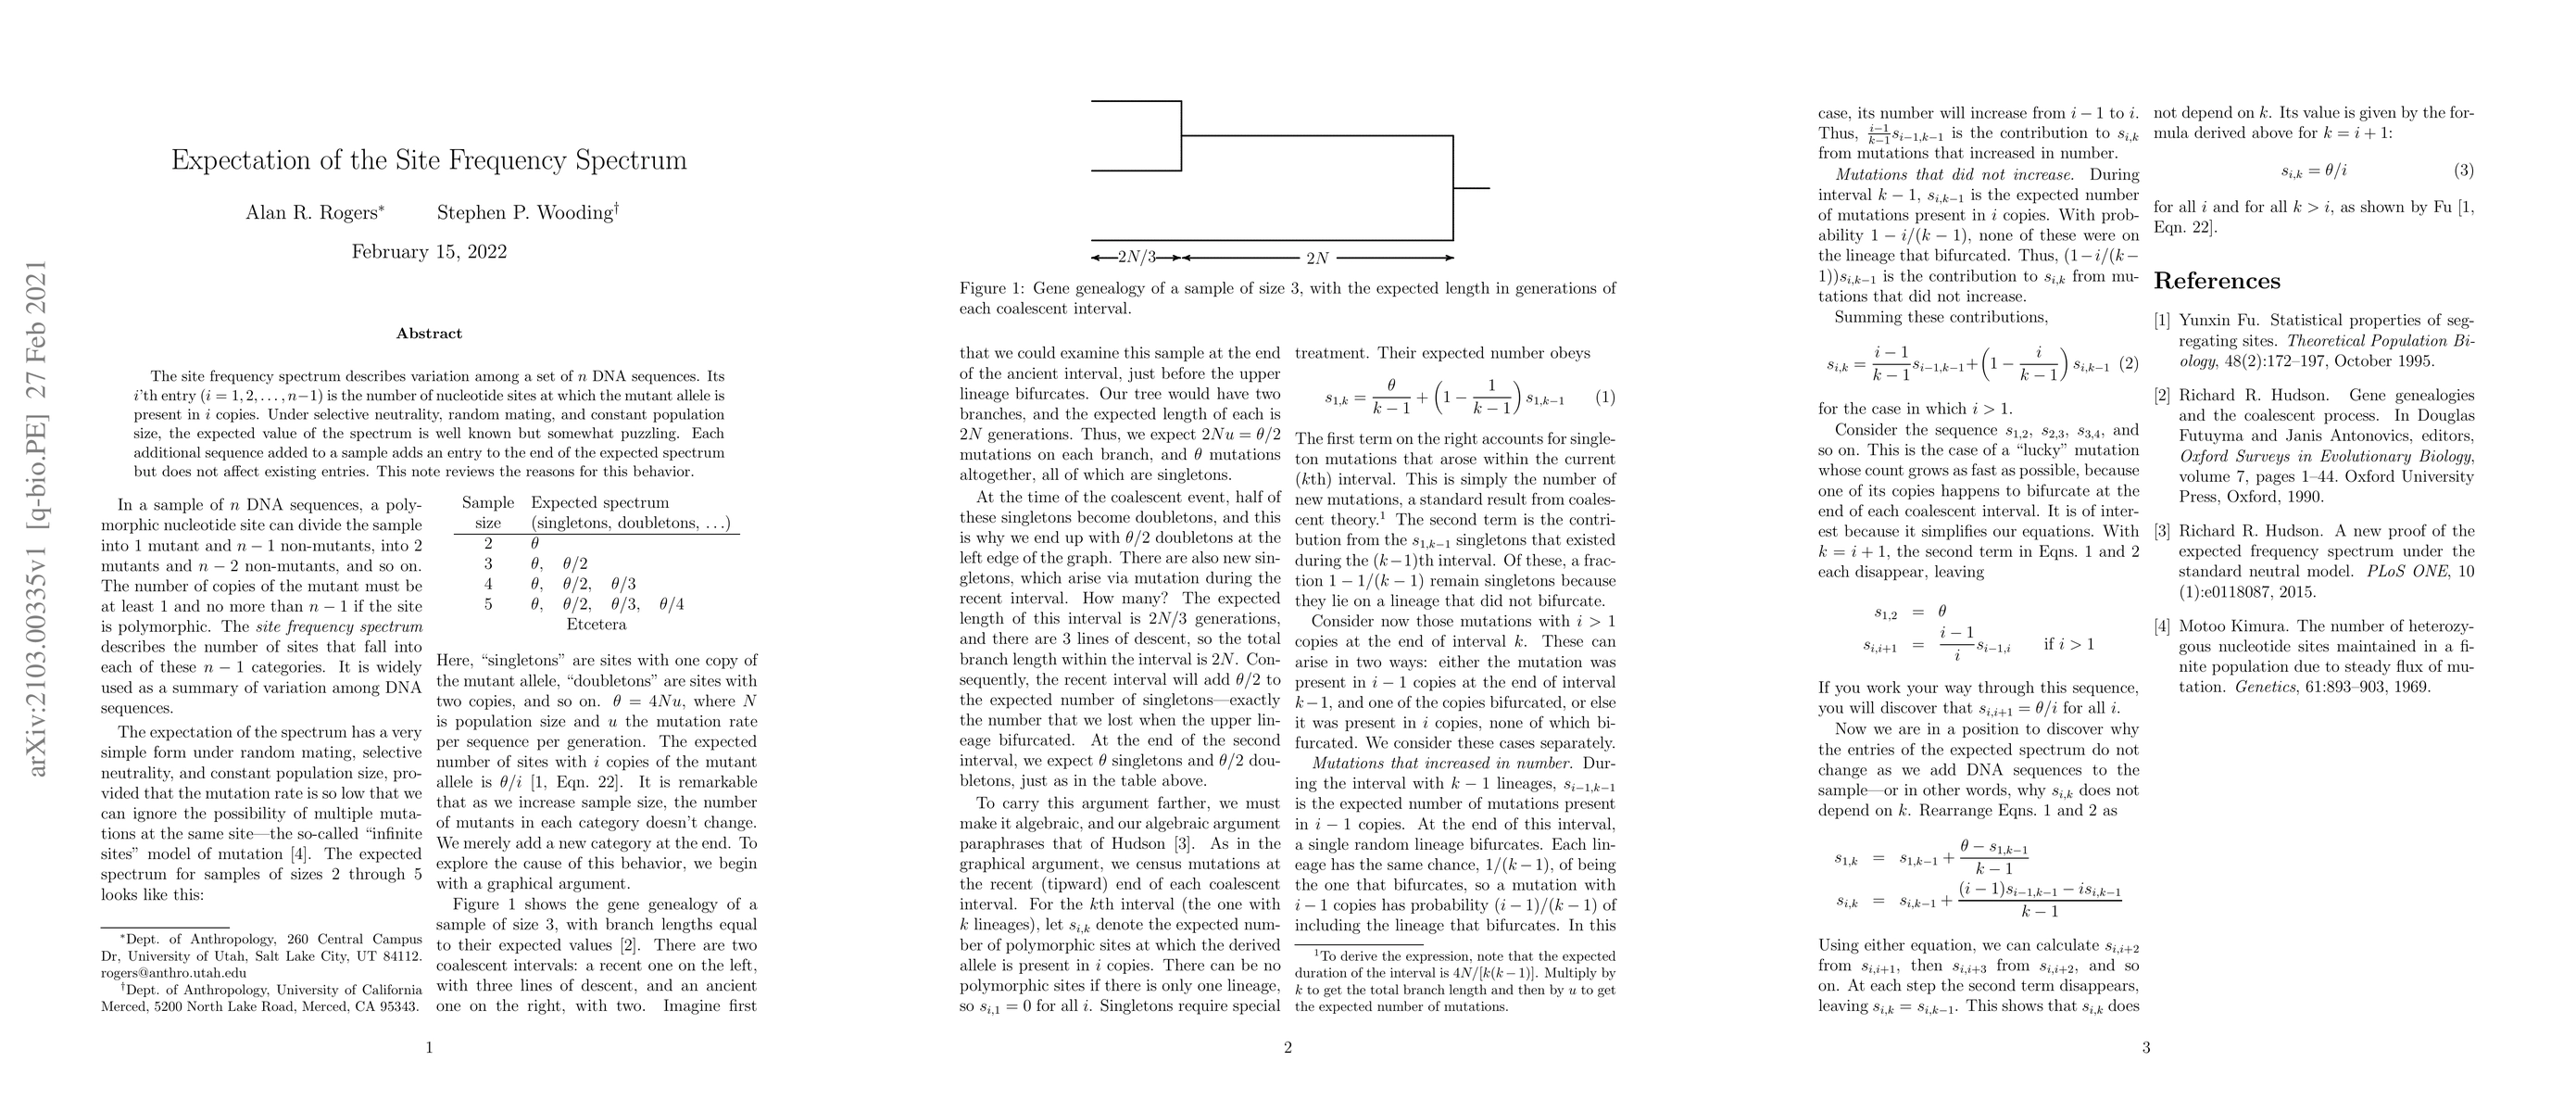
The site frequency spectrum describes variation among a set of n DNA sequences. Its i'th entry (i=1,2,...,n-1) is the number of nucleotide sites at which the mutant allele is present in i copies. Under selective neutrality, random mating, and constant population size, the expected value of the spectrum is well known but somewhat puzzling. Each additional sequence added to a sample adds an entry to the end of the expected spectrum but does not affect existing entries. This note reviews the reasons for this behavior.
AI Key Findings
Get AI-generated insights about this paper's methodology, results, significance, and more — seven facets brought into focus.
Impact
Paper Details
Authors
PDF Preview
Key Terms
Citation Network
Current paper (gray), citations (green), references (blue)
Display is limited for performance on very large graphs.
Discussion 0