Experiments and a User Study for Hierarchical Drawings of Graphs
Publication
Metrics
AI Quick Summary
This paper introduces a new hierarchical graph drawing technique based on the Path Based Framework (PBF) that minimizes drawing height and compares it to the Sugiyama framework. The user study results indicate that the new method is preferred for clarity, readability, and usability.
Paper Preview
Abstract
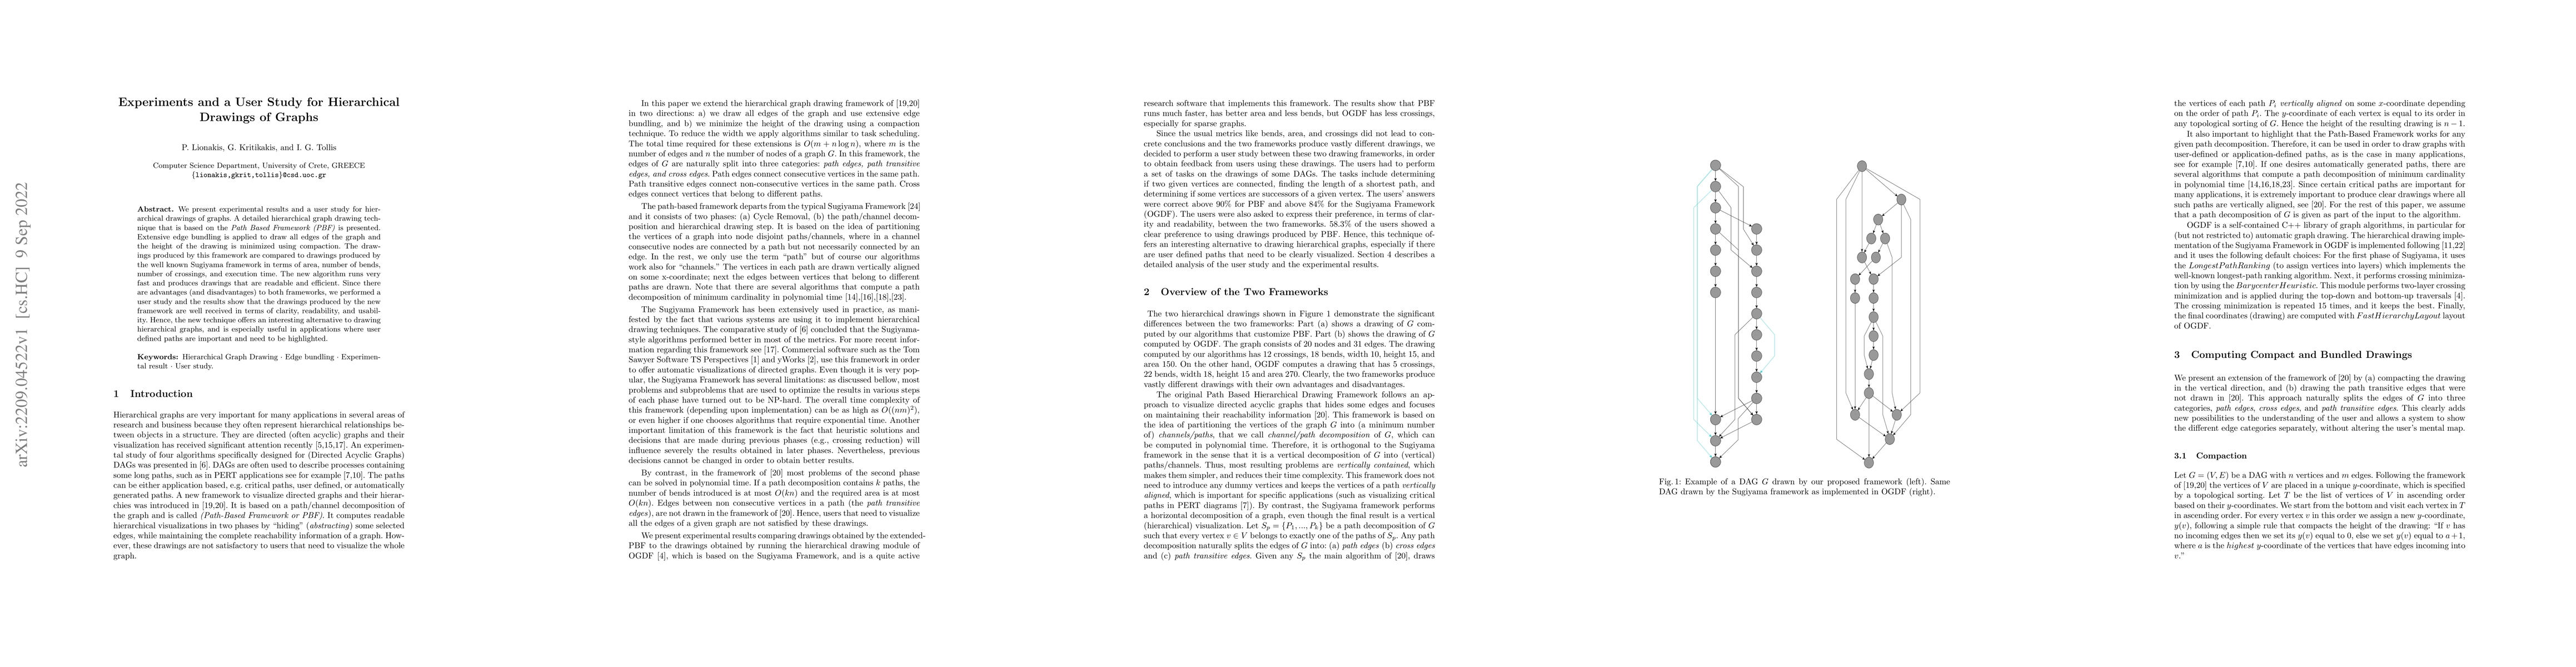
We present experimental results and a user study for hierarchical drawings of graphs. A detailed hierarchical graph drawing technique that is based on the Path Based Framework (PBF) is presented. Extensive edge bundling is applied to draw all edges of the graph and the height of the drawing is minimized using compaction. The drawings produced by this framework are compared to drawings produced by the well known Sugiyama framework in terms of area, number of bends, number of crossings, and execution time. The new algorithm runs very fast and produces drawings that are readable and efficient. Since there are advantages (and disadvantages) to both frameworks, we performed a user study and the results show that the drawings produced by the new framework are well received in terms of clarity, readability, and usability. Hence, the new technique offers an interesting alternative to drawing hierarchical graphs, and is especially useful in applications where user defined paths are important and need to be highlighted.
AI Key Findings
Get AI-generated insights about this paper's methodology, results, significance, and more — seven facets brought into focus.
Impact
Paper Details
Authors
PDF Preview
Key Terms
Citation Network
Current paper (gray), citations (green), references (blue)
Display is limited for performance on very large graphs.
Discussion 0