This paper explores "expert exploranation," a method combining explanatory and exploratory visualization to communicate scientific methods to other researchers. Developed interactive visual stories for a spatio-temporal conflict event method received positive feedback from both novice and expert conflict researchers, indicating its potential to enhance methodological understanding and scientific outreach.
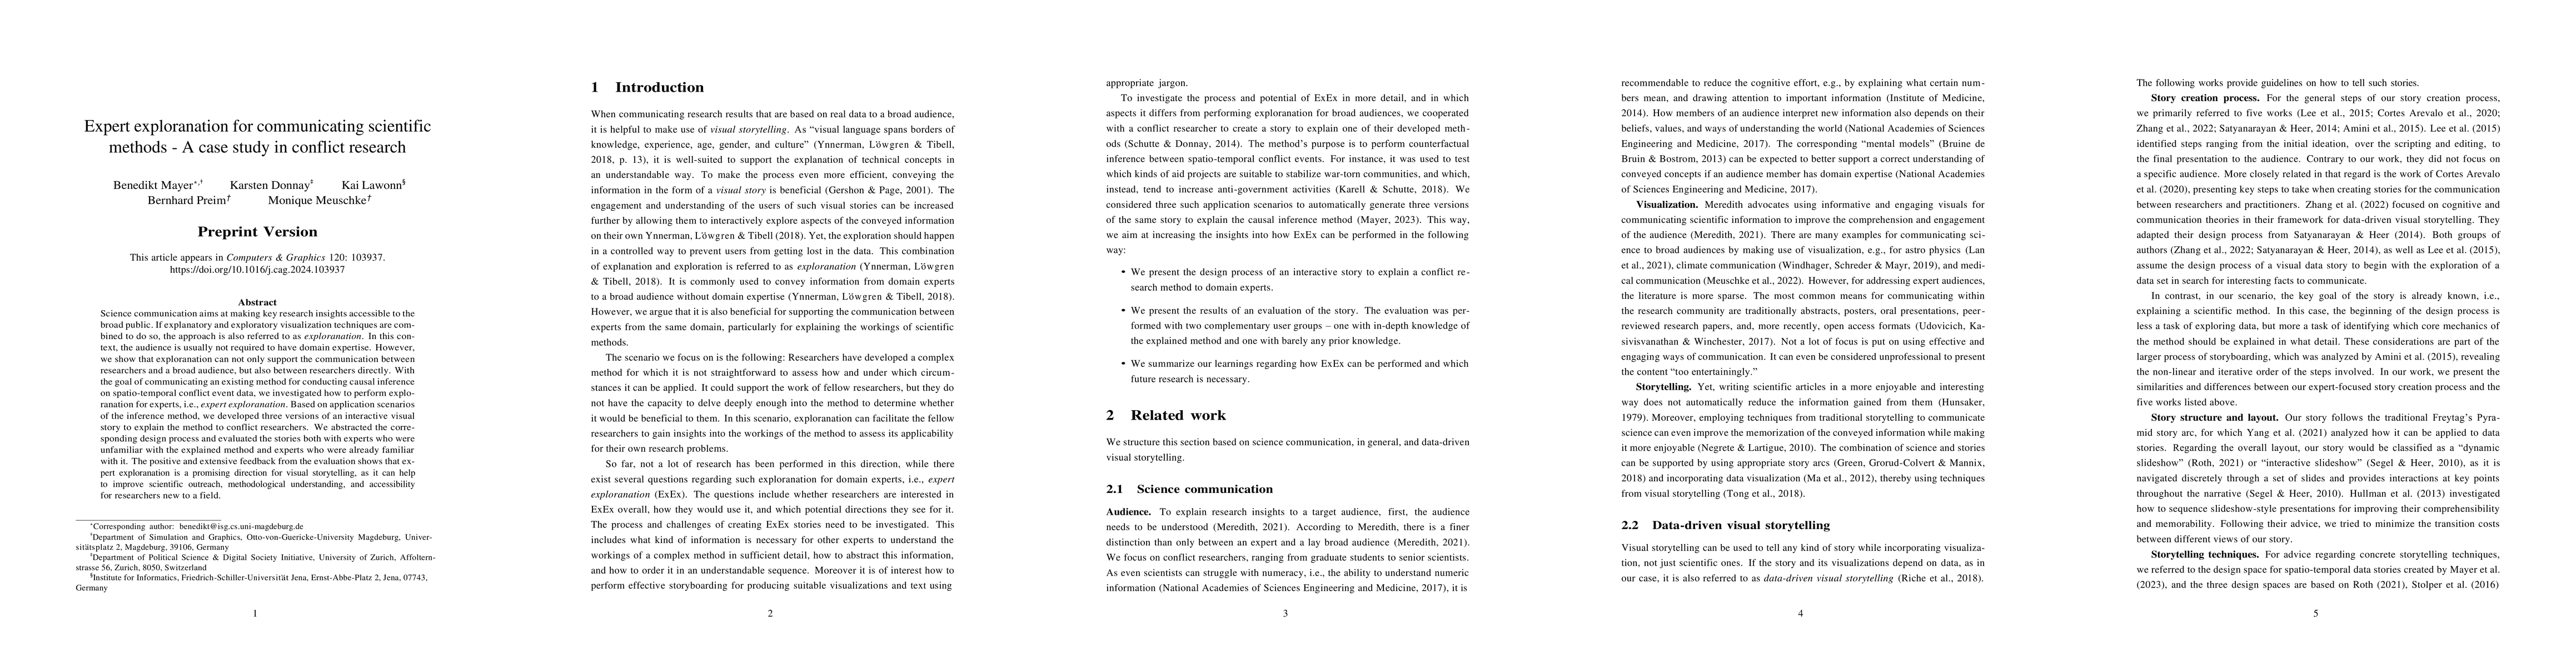
Science communication aims at making key research insights accessible to the broad public. If explanatory and exploratory visualization techniques are combined to do so, the approach is also referred to as exploranation. In this context, the audience is usually not required to have domain expertise. However, we show that exploranation can not only support the communication between researchers and a broad audience, but also between researchers directly. With the goal of communicating an existing method for conducting causal inference on spatio-temporal conflict event data, we investigated how to perform exploranation for experts, i.e., expert exploranation. Based on application scenarios of the inference method, we developed three versions of an interactive visual story to explain the method to conflict researchers. We abstracted the corresponding design process and evaluated the stories both with experts who were unfamiliar with the explained method and experts who were already familiar with it. The positive and extensive feedback from the evaluation shows that expert exploranation is a promising direction for visual storytelling, as it can help to improve scientific outreach, methodological understanding, and accessibility for researchers new to a field.
Get AI-generated insights about this paper's methodology, results, and significance.
Current paper (gray), citations (green), references (blue)
No similar papers found for this research.
Title | Authors | Year | Actions |
---|---|---|---|
Editorial note Computers & Graphics Issue 120
|
2024
|
View Paper |
Title | Authors | Year | Actions |
---|---|---|---|
A Characterization of Interactive Visual Data Stories With a Spatio‐Temporal Context
|
Benedikt Mayer, Nastasja Steinhauer, B. Preim, M. Meuschke
|
2023
|
View Paper |
Moliverse: Contextually embedding the microcosm into the universe
|
Mathis Brossier, Robin Skånberg, Lonni Besançon, M. Linares, Tobias Isenberg, Anders Ynnerman, A. Bock
|
2023
|
View Paper |
A Visual Data Storytelling Framework
|
Yangjinbo Zhang, Mark Reynolds, A. Lugmayr, Katarina Damjanov, G. Hassan
|
2022
|
View Paper |
Erato: Cooperative Data Story Editing via Fact Interpolation
|
Mengdi Sun, Ligan Cai, Weiwei Cui, Yanqiu Wu, Yang Shi, Nan Cao
|
2022
|
View Paper |
Narrative medical visualization to communicate disease data
|
M. Meuschke, L. Garrison, N. Smit, B. Bach, S. Mittenentzwei, V. Weiß, S. Bruckner, K. Lawonn, B. Preim
|
2022
|
View Paper |
How Does Automation Shape the Process of Narrative Visualization: A Survey of Tools
|
Qing Chen, Shixiong Cao, Jiazhe Wang, Nan Cao
|
2022
|
View Paper |
A Design Space for Applying the Freytag's Pyramid Structure to Data Stories
|
Leni Yang, Xian Xu, Xingyu Lan, Ziyan Liu, Shunan Guo, Yang Shi, Huamin Qu, Nan Cao
|
2021
|
View Paper |
A Deeper Understanding of Visualization‐Text Interplay in Geographic Data‐driven Stories
|
T. V. Landesberger, Shahid Latif, Siming Chen, Fabian Beck
|
2021
|
View Paper |
Visualization in Astrophysics: Developing New Methods, Discovering Our Universe, and Educating the Earth
|
Fangfei Lan, Michael Young, Lauren Anderson, A. Ynnerman, A. Bock, M. Borkin, A. Forbes, J. Kollmeier, Bei Wang
|
2021
|
View Paper |
Communicating with Interactive Articles
|
Fred Hohman, Matthew Conlen, Jeffrey Heer, Duen Horng Chau
|
2020
|
View Paper |
How to evaluate data visualizations across different levels of understanding
|
Alyxander Burns, Cindy Xiong, S. Franconeri, A. Cairo, Narges Mahyar
|
2020
|
View Paper |
Cartographic Design as Visual Storytelling: Synthesis and Review of Map-Based Narratives, Genres, and Tropes
|
R. Roth
|
2020
|
View Paper |
What Makes a Data-GIF Understandable?
|
Xinhuan Shu, Aoyu Wu, Junxiu Tang, B. Bach, Yingcai Wu, Huamin Qu
|
2020
|
View Paper |
Storylines for practice: a visual storytelling approach to strengthen the science-practice interface
|
V. J. C. Arevalo
|
2020
|
View Paper |
Linking and Layout: Exploring the Integration of Text and Visualization in Storytelling
|
Qiyu Zhi, Alvitta Ottley, Ronald A. Metoyer
|
2019
|
View Paper |
Aid, exclusion, and the local dynamics of insurgency in Afghanistan
|
Daniel Karell, Sebastian Schutte
|
2018
|
View Paper |
Communicating Science Effectively: A Research Agenda
|
Washington Dc
|
2018
|
View Paper |
Exploranation: A New Science Communication Paradigm
|
A. Ynnerman, J. Löwgren, L. Tibell
|
2018
|
View Paper |
Hooked on data videos: assessing the effect of animation and pictographs on viewer engagement
|
Fereshteh Amini, N. Riche, Bongshin Lee, Jason Leboe-McGowan, Pourang Irani
|
2018
|
View Paper |
OpenSpace: Changing the Narrative of Public Dissemination in Astronomical Visualization from What to How
|
A. Bock, Emil Axelsson, C. Emmart, M. Kuznetsova, C. Hansen, A. Ynnerman
|
2018
|
View Paper |
Storytelling and Visualization: An Extended Survey
|
Chao Tong, Richard C. Roberts, R. Borgo, S. Walton, R. Laramee, Kodzo Wegba, Aidong Lu, Yun Wang, Huamin Qu, Qiong Luo, Xiaojuan Ma
|
2018
|
View Paper |
Once upon a Spacetime: Visual Storytelling in Cognitive and Geotemporal Information Spaces
|
E. Mayr, F. Windhager
|
2018
|
View Paper |
Uniting science and stories: Perspectives on the value of storytelling for communicating science
|
S. Green, K. Grorud‐Colvert, H. Mannix
|
2018
|
View Paper |
Communicating your research (part 1) – to the scientific community
|
Cristian Udovicich, V. Kasivisvanathan, C. Winchester
|
2017
|
View Paper |
Visual Narrative Flow: Exploring Factors Shaping Data Visualization Story Reading Experiences
|
Sean McKenna, N. Riche, Bongshin Lee, Jeremy Boy, Miriah D. Meyer
|
2017
|
View Paper |
Assessing User Engagement in Information Visualization
|
Ya-Hsin Hung, Paul C. Parsons
|
2017
|
View Paper |
ChartAccent: Annotation for data-driven storytelling
|
Donghao Ren, M. Brehmer, Bongshin Lee, Tobias Höllerer, E. Choe
|
2017
|
View Paper |
Emerging and Recurring Data-Driven Storytelling Techniques: Analysis of a Curated Collection of Recent Stories
|
Charles D. Stolper, Bongshin Lee, N. Riche, J. Stasko
|
2016
|
View Paper |
More Than Telling a Story: Transforming Data into Visually Shared Stories
|
Bongshin Lee, N. Riche, Petra Isenberg, Sheelagh Carpendale
|
2015
|
View Paper |
Understanding Data Videos: Looking at Narrative Visualization through the Cinematography Lens
|
Fereshteh Amini, N. Riche, Bongshin Lee, C. Hurter, Pourang Irani
|
2015
|
View Paper |
Numeracy and the Affordable Care Act: Opportunities and Challenges
|
E. Peters, Louise Meilleur, M. Tompkins
|
2014
|
View Paper |
Authoring Narrative Visualizations with Ellipsis
|
Arvind Satyanarayan, Jeffrey Heer
|
2014
|
View Paper |
Matched Wake Analysis: Finding Causal Relationships in Spatiotemporal Event Data
|
Sebastian Schutte, K. Donnay
|
2014
|
View Paper |
A Deeper Understanding of Sequence in Narrative Visualization
|
J. Hullman, S. Drucker, N. Riche, Bongshin Lee, Danyel Fisher, Eytan Adar
|
2013
|
View Paper |
Assessing what to address in science communication
|
W. Bruine de Bruin, A. Bostrom
|
2013
|
View Paper |
Explaining research: how to reach key audiences to advance your work
|
A. Bacchi
|
2013
|
View Paper |
Human-Centered Approaches in Geovisualization Design: Investigating Multiple Methods Through a Long-Term Case Study
|
D. Lloyd, J. Dykes
|
2011
|
View Paper |
Visualization Rhetoric: Framing Effects in Narrative Visualization
|
J. Hullman, N. Diakopoulos
|
2011
|
View Paper |
Narrative Visualization: Telling Stories with Data
|
E. Segel, Jeffrey Heer
|
2010
|
View Paper |
The science of telling stories: Evaluating science communication via narratives (RIRC method)
|
Aquiles Negrete, Cecilia Lartigue
|
2010
|
View Paper |
Useful junk?: the effects of visual embellishment on comprehension and memorability of charts
|
Scott Bateman, R. Mandryk, C. Gutwin, Aaron Genest, D. McDine, Christopher A. Brooks
|
2010
|
View Paper |
Controlled user evaluations of information visualization interfaces for text retrieval: Literature review and meta-analysis
|
Charles-Antoine Julien, J. Leide
|
2008
|
View Paper |
Animated Transitions in Statistical Data Graphics
|
Jeffrey Heer, G. Robertson
|
2007
|
View Paper |
The Effect of Aesthetic on the Usability of Data Visualization
|
Nick Cawthon, A. Moere
|
2007
|
View Paper |
Interactive Lecture Demonstrations
|
D. Sokoloff, R. Thornton
|
2004
|
View Paper |
What storytelling can do for information visualization
|
N. Gershon, Ward Page
|
2001
|
View Paper |
Enjoyment and Information Gain in Science Articles
|
A. Hunsaker
|
1979
|
View Paper |
) Matched Wake Analysis: R package
|
2023
|
||
Case Studies for Working with Domain Experts
|
Johanna Beyer, C. Hansen, M. Hlawitschka, I. Hotz, B. Kozlíková, G. Scheuermann, M. Stommel, M. Streit, Johannes Waschke, T. Wischgoll, Yong Wan
|
2020
|
View Paper |
Reflections on Visualization for Broad Audiences
|
M. Böttinger, H. Kostis, Maria C. Velez-Rojas, P. Rheingans, A. Ynnerman
|
2020
|
View Paper |
Collaborating Successfully with Domain Experts
|
M. Hlawitschka, G. Scheuermann, Christian Blecha, M. Streit, Amitabh Varshney
|
2020
|
View Paper |
On Inconvenient Images: Exploring the Design Space of Engaging Climate Change Visualizations for Public Audiences
|
F. Windhager, Günther Schreder, E. Mayr
|
2019
|
View Paper |
The standard errors of persistence Available at SSRN
|
2019
|
||
Data-Driven Storytelling
|
N. Riche, C. Hurter, N. Diakopoulos, Sheelagh Carpendale
|
2017
|
View Paper |
Causal Inference without Balance Checking: Coarsened Exact Matching
|
S. Iacus, Gary King, G. Porro
|
2012
|
View Paper |
Scientific Storytelling Using Visualization
|
K. Ma, Isaac Liao, Jennifer Frazier, H. Hauser, H. Kostis
|
2012
|
View Paper |
Taxonomy of educational objectives: The Classification of educational goals. Handbook II: Affective domain / David R. Krathwohl, Benyamin S. Bloom, Bertram B. Masia
|
D. Krathwohl
|
1964
|
View Paper |
Affoltern-strasse 56, Zurich, 8050, Switzerland § Institute for Informatics, Friedrich-Schiller-Universit¨at Jena, Ernst-Abbe-Platz 2, Jena, 07743, Germany
|
Showing first page preview. Click "Open Full PDF" to view the complete paper.
Your comment contains inappropriate language and has been rejected.
Are you sure you want to remove this tag? This action cannot be undone.
Someone just favorited a paper!
Comments (0)