Authors
Summary
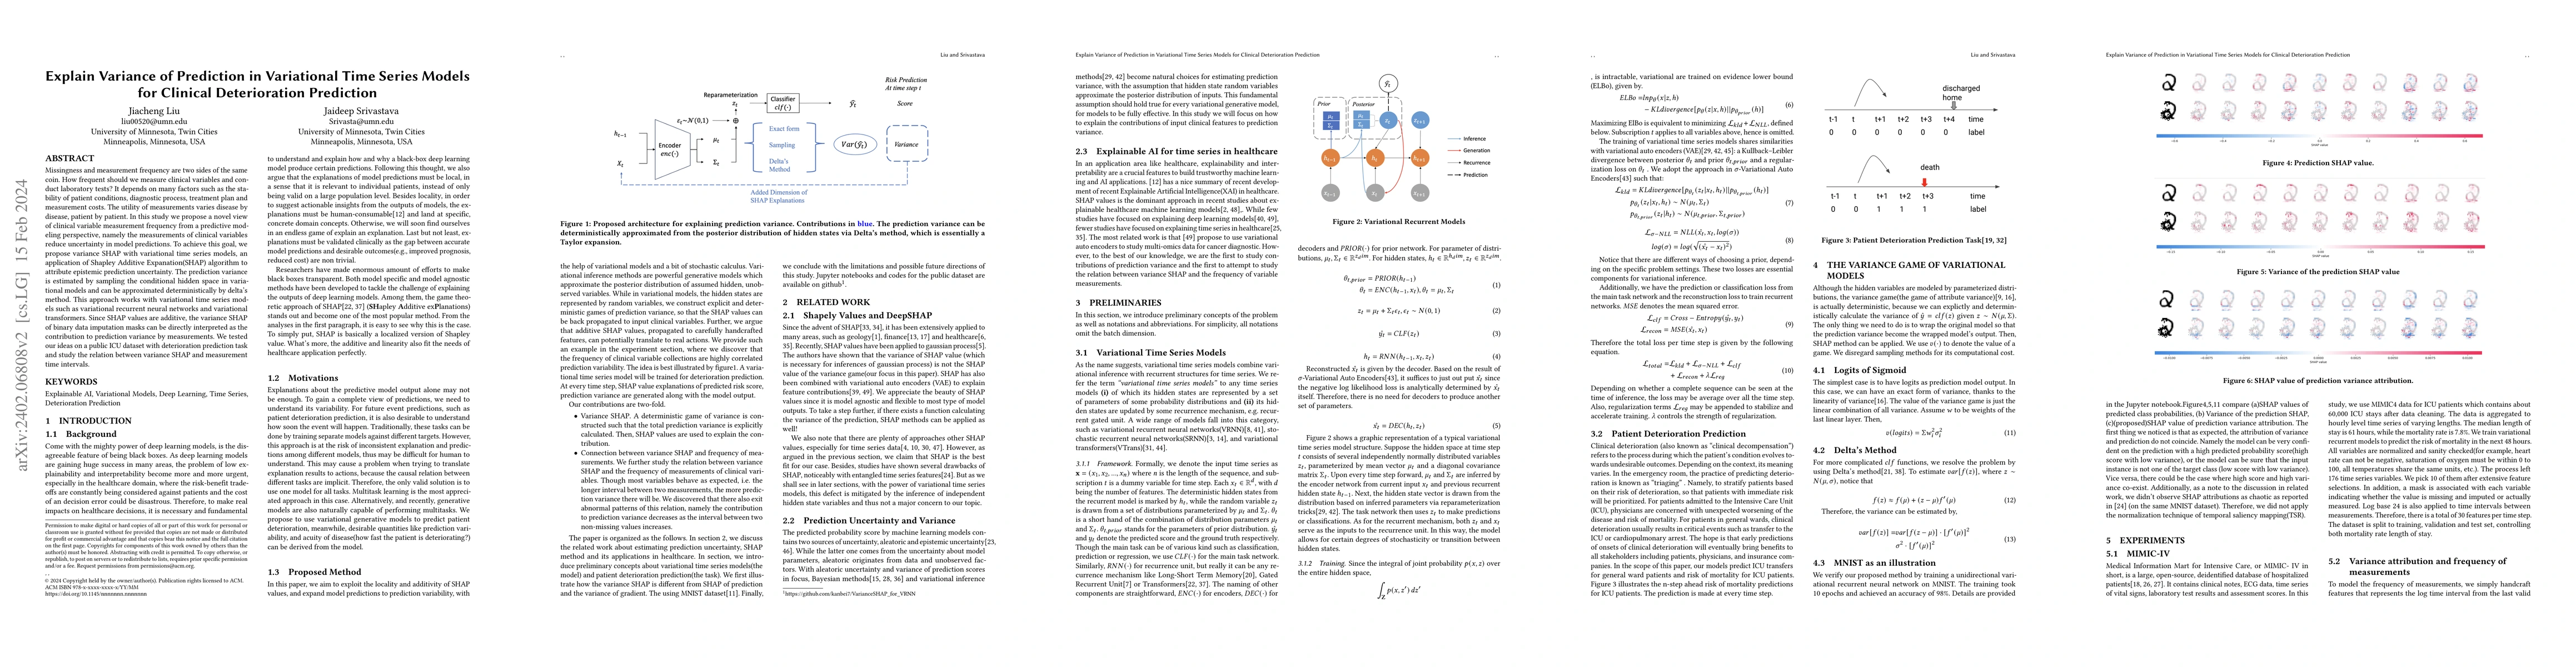
Missingness and measurement frequency are two sides of the same coin. How frequent should we measure clinical variables and conduct laboratory tests? It depends on many factors such as the stability of patient conditions, diagnostic process, treatment plan and measurement costs. The utility of measurements varies disease by disease, patient by patient. In this study we propose a novel view of clinical variable measurement frequency from a predictive modeling perspective, namely the measurements of clinical variables reduce uncertainty in model predictions. To achieve this goal, we propose variance SHAP with variational time series models, an application of Shapley Additive Expanation(SHAP) algorithm to attribute epistemic prediction uncertainty. The prediction variance is estimated by sampling the conditional hidden space in variational models and can be approximated deterministically by delta's method. This approach works with variational time series models such as variational recurrent neural networks and variational transformers. Since SHAP values are additive, the variance SHAP of binary data imputation masks can be directly interpreted as the contribution to prediction variance by measurements. We tested our ideas on a public ICU dataset with deterioration prediction task and study the relation between variance SHAP and measurement time intervals.
AI Key Findings
Get AI-generated insights about this paper's methodology, results, and significance.
Paper Details
PDF Preview
Key Terms
Citation Network
Current paper (gray), citations (green), references (blue)
Display is limited for performance on very large graphs.
Similar Papers
Found 4 papersDeterioration Prediction using Time-Series of Three Vital Signs and Current Clinical Features Amongst COVID-19 Patients
Farah E. Shamout, S. Farokh Atashzar, Yao Wang et al.
Foundation models for time series forecasting: Application in conformal prediction
Duong Nguyen, Sami Achour, Nicolas Chesneau et al.
No citations found for this paper.
Comments (0)