Explaining Graph Neural Networks for Node Similarity on Graphs
Publication
Metrics
AI Quick Summary
This paper investigates explainable similarity search in graph neural networks (GNNs) by evaluating two explanation methods: mutual information (MI) and gradient-based (GB) explanations. The study finds that gradient-based explanations are more desirable due to their actionability, consistency, and ability to be pruned for sparsity.
Paper Preview
Abstract
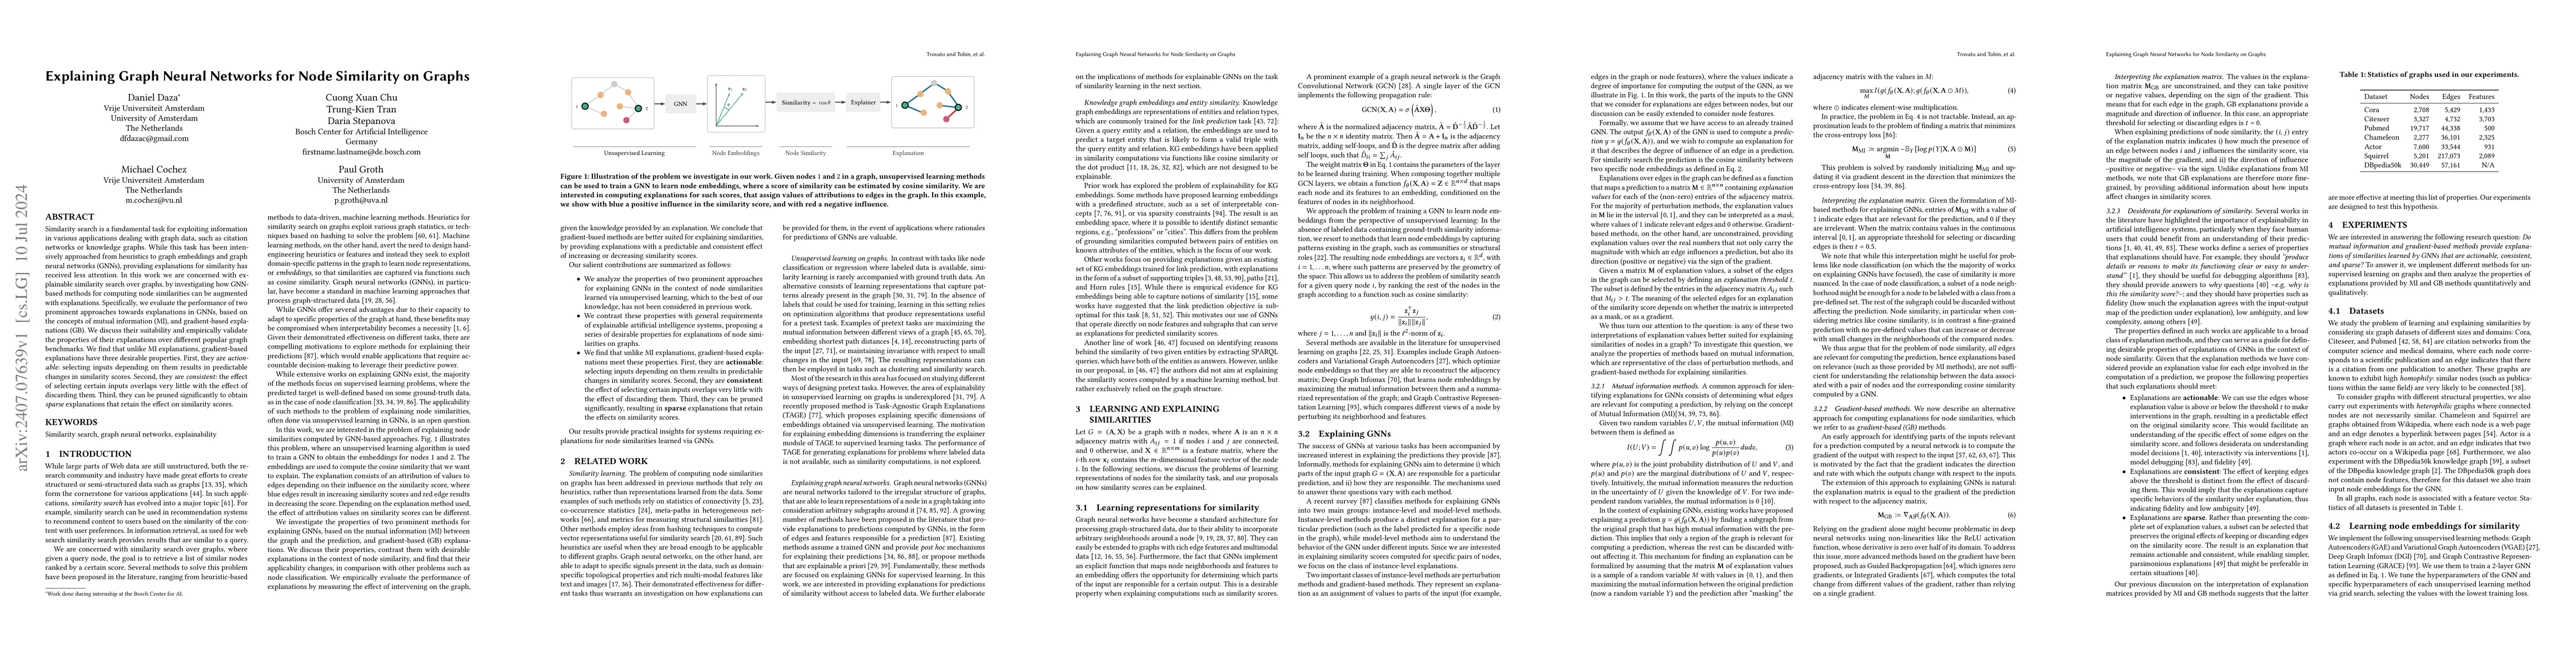
Similarity search is a fundamental task for exploiting information in various applications dealing with graph data, such as citation networks or knowledge graphs. While this task has been intensively approached from heuristics to graph embeddings and graph neural networks (GNNs), providing explanations for similarity has received less attention. In this work we are concerned with explainable similarity search over graphs, by investigating how GNN-based methods for computing node similarities can be augmented with explanations. Specifically, we evaluate the performance of two prominent approaches towards explanations in GNNs, based on the concepts of mutual information (MI), and gradient-based explanations (GB). We discuss their suitability and empirically validate the properties of their explanations over different popular graph benchmarks. We find that unlike MI explanations, gradient-based explanations have three desirable properties. First, they are actionable: selecting inputs depending on them results in predictable changes in similarity scores. Second, they are consistent: the effect of selecting certain inputs overlaps very little with the effect of discarding them. Third, they can be pruned significantly to obtain sparse explanations that retain the effect on similarity scores.
AI Key Findings
Get AI-generated insights about this paper's methodology, results, significance, and more — seven facets brought into focus.
Impact
Authors
PDF Preview
Key Terms
Citation Network
Current paper (gray), citations (green), references (blue)
Display is limited for performance on very large graphs.
Discussion 0