Explaining Representation Learning with Perceptual Components
Publication
Metrics
AI Quick Summary
This paper introduces a method to interpret self-supervised representation spaces using perceptual components: color, shape, and texture. By masking these components and observing representation changes, it creates importance maps that offer intuitive, human-visual-system-aligned explanations in label-free scenarios.
Paper Preview
Abstract
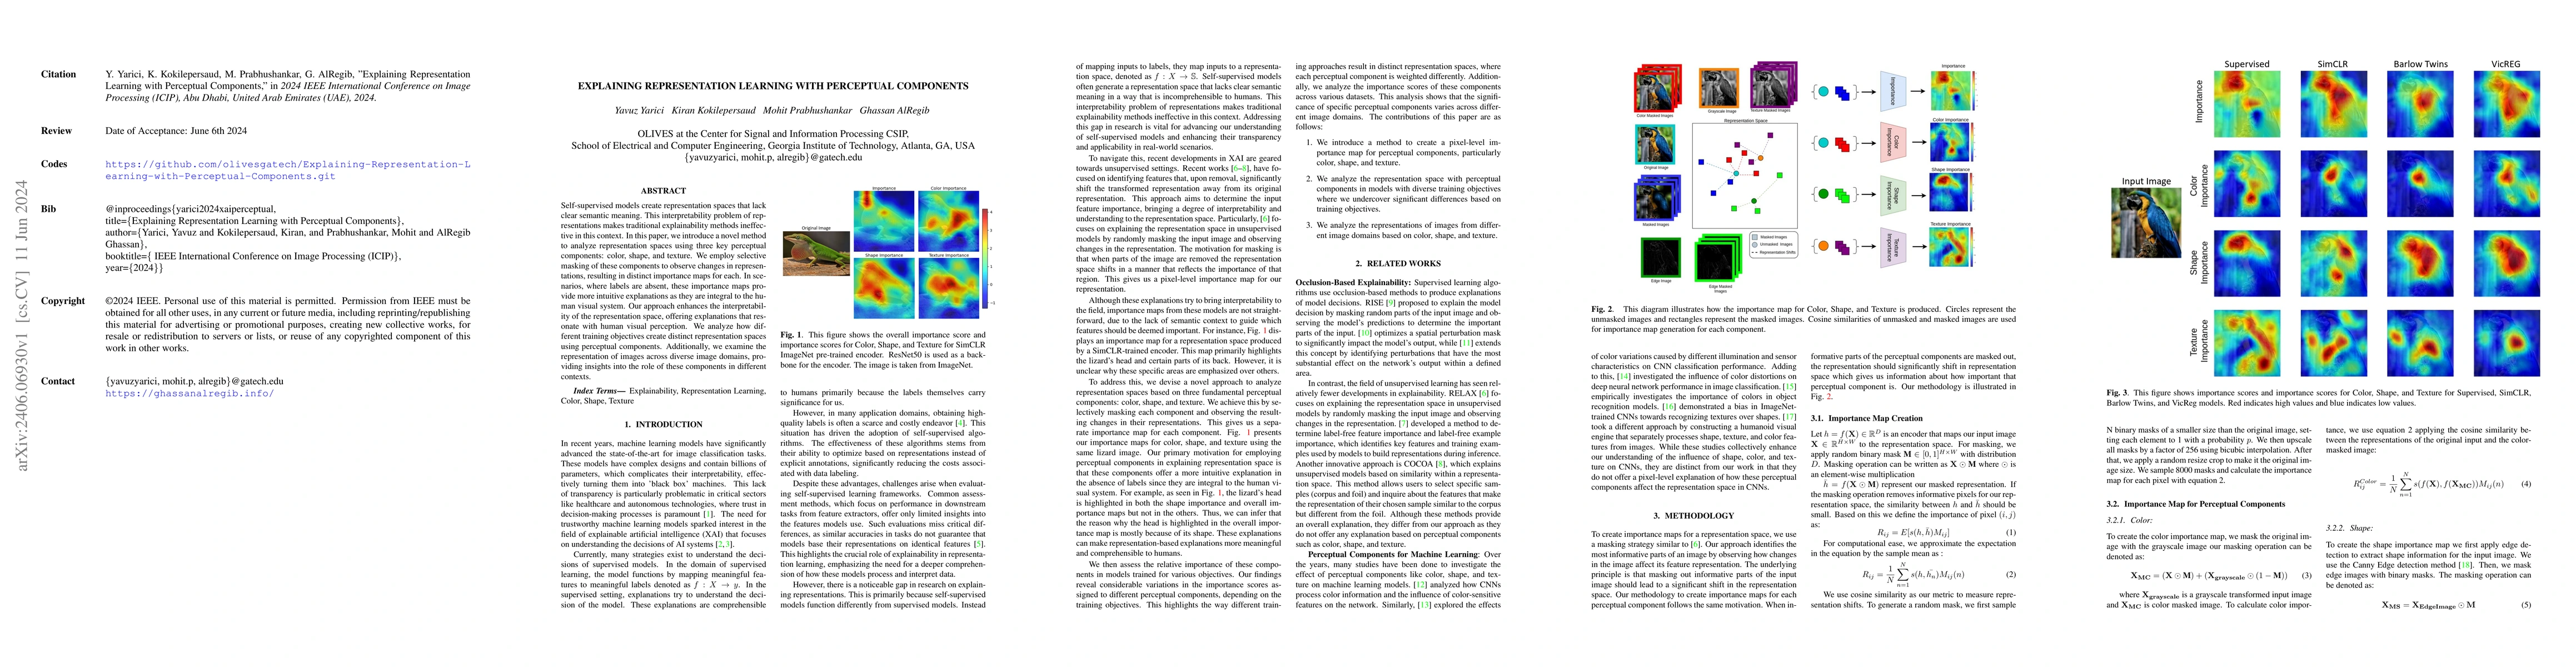
Self-supervised models create representation spaces that lack clear semantic meaning. This interpretability problem of representations makes traditional explainability methods ineffective in this context. In this paper, we introduce a novel method to analyze representation spaces using three key perceptual components: color, shape, and texture. We employ selective masking of these components to observe changes in representations, resulting in distinct importance maps for each. In scenarios, where labels are absent, these importance maps provide more intuitive explanations as they are integral to the human visual system. Our approach enhances the interpretability of the representation space, offering explanations that resonate with human visual perception. We analyze how different training objectives create distinct representation spaces using perceptual components. Additionally, we examine the representation of images across diverse image domains, providing insights into the role of these components in different contexts.
AI Key Findings
Get AI-generated insights about this paper's methodology, results, significance, and more — seven facets brought into focus.
Impact
Paper Details
Authors
PDF Preview
Key Terms
Citation Network
Current paper (gray), citations (green), references (blue)
Display is limited for performance on very large graphs.
Discussion 0