Summary
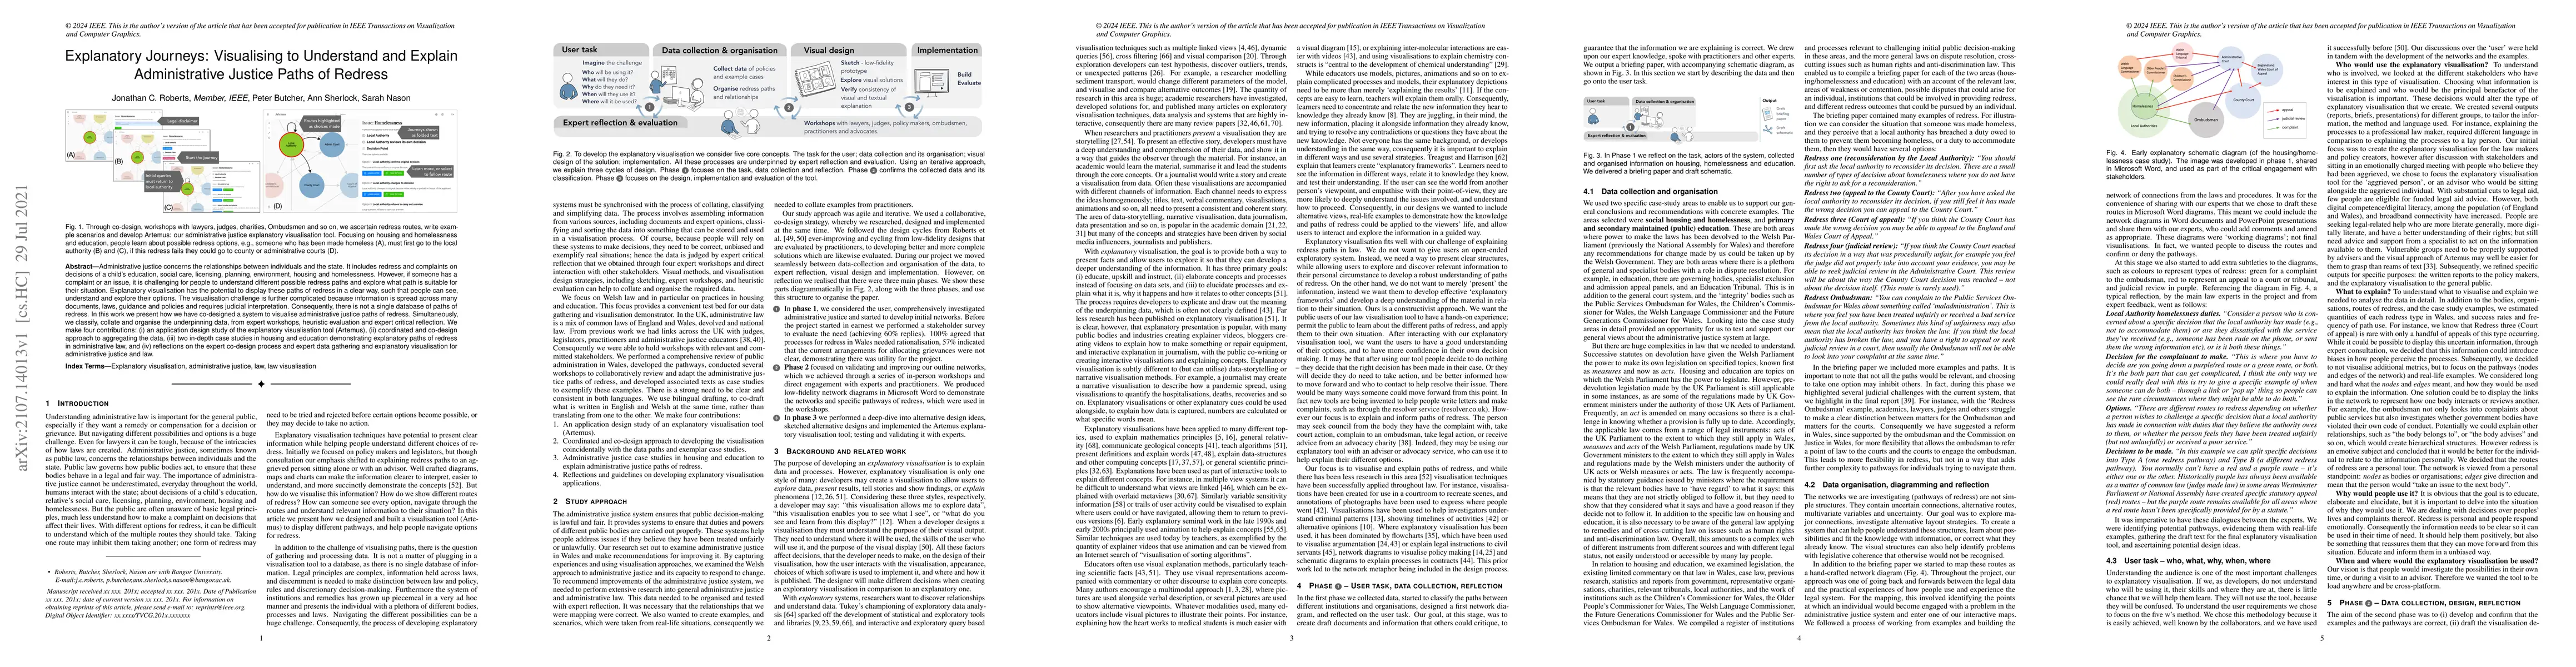
Administrative justice concerns the relationships between individuals and the state. It includes redress and complaints on decisions of a child's education, social care, licensing, planning, environment, housing and homelessness. However, if someone has a complaint or an issue, it is challenging for people to understand different possible redress paths and explore what path is suitable for their situation. Explanatory visualisation has the potential to display these paths of redress in a clear way, such that people can see, understand and explore their options. The visualisation challenge is further complicated because information is spread across many documents, laws, guidance and policies and requires judicial interpretation. Consequently, there is not a single database of paths of redress. In this work we present how we have co-designed a system to visualise administrative justice paths of redress. Simultaneously, we classify, collate and organise the underpinning data, from expert workshops, heuristic evaluation and expert critical reflection. We make four contributions: (i) an application design study of the explanatory visualisation tool (Artemus), (ii) coordinated and co-design approach to aggregating the data, (iii) two in-depth case studies in housing and education demonstrating explanatory paths of redress in administrative law, and (iv) reflections on the expert co-design process and expert data gathering and explanatory visualisation for administrative justice and law.
AI Key Findings
Get AI-generated insights about this paper's methodology, results, and significance.
Paper Details
PDF Preview
Key Terms
Citation Network
Current paper (gray), citations (green), references (blue)
Display is limited for performance on very large graphs.
Similar Papers
Found 4 papersExplanatory Model Monitoring to Understand the Effects of Feature Shifts on Performance
Volker Tresp, Florian Buettner, Thomas Decker et al.
What Leads to Administrative Bloat? A Dynamic Model of Administrative Cost and Waste
Vicky Chuqiao Yang, Levi Grenier
| Title | Authors | Year | Actions |
|---|
Comments (0)