Exploring and Visualizing COVID-19 Trends in India: Vulnerabilities and Mitigation Strategies
Publication
Metrics
AI Quick Summary
This paper analyzes COVID-19 trends in India, focusing on infection spikes in 2020 and the role of vaccination centers in mitigating the spread, using data visualization for effective interpretation and policy-making. The study underscores the importance of data visualization in addressing public health crises.
Paper Preview
Abstract
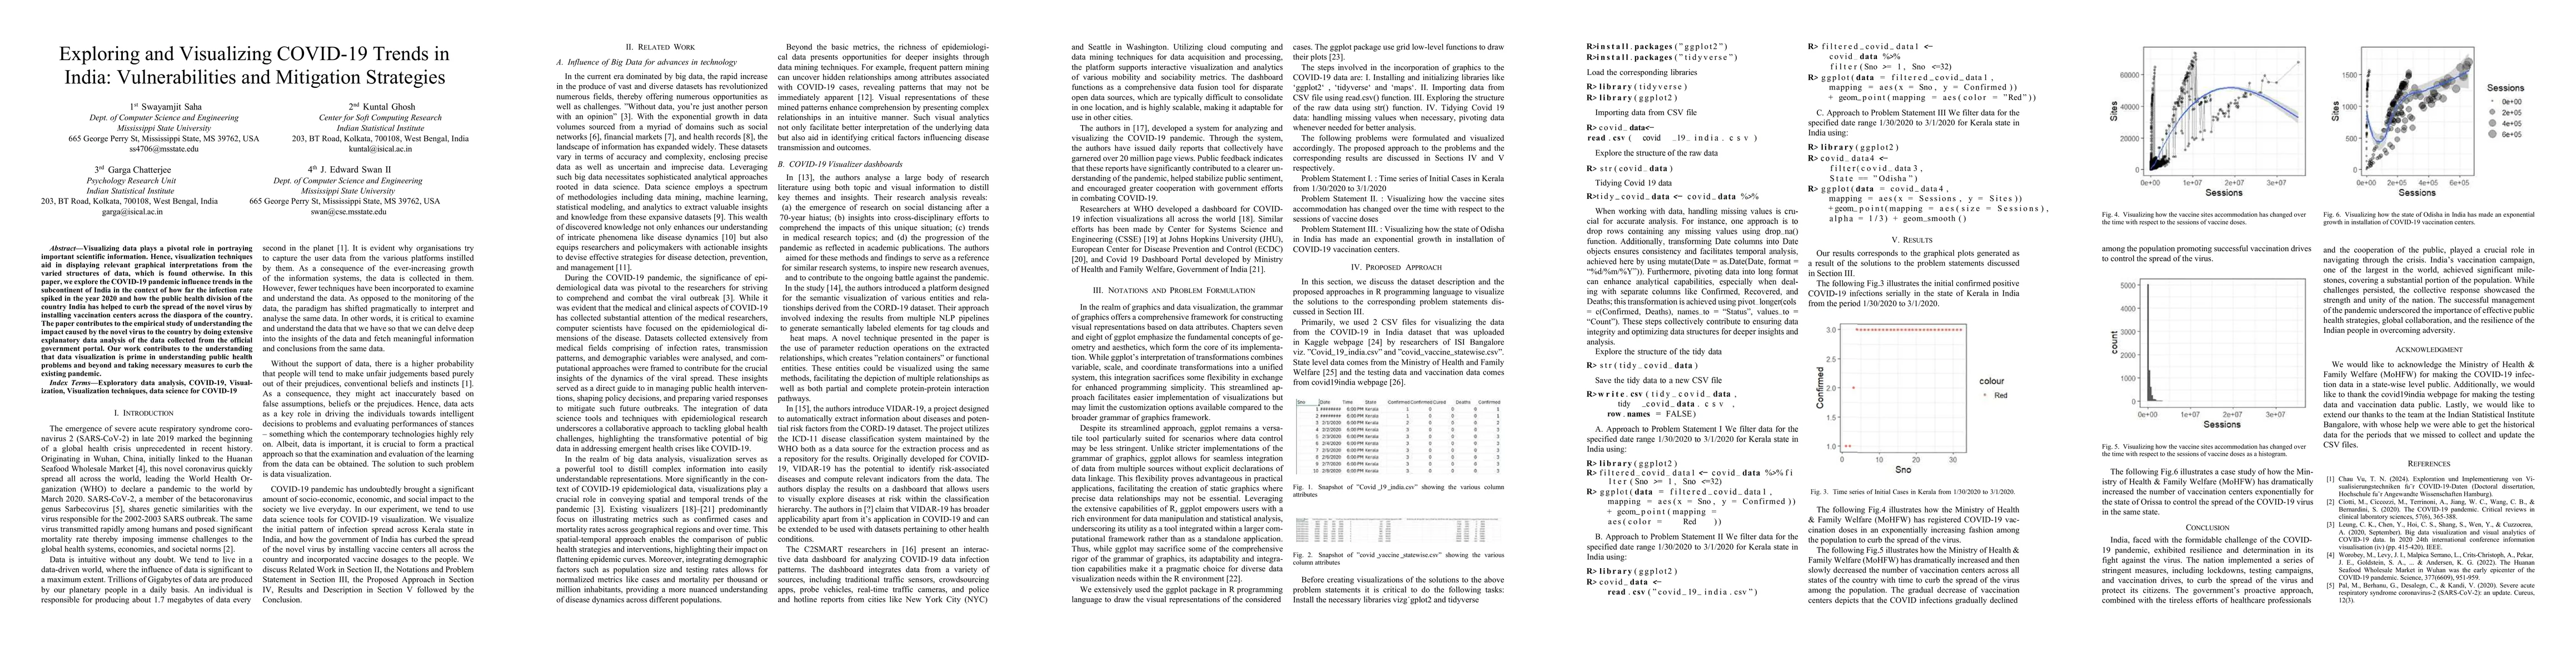
Visualizing data plays a pivotal role in portraying important scientific information. Hence, visualization techniques aid in displaying relevant graphical interpretations from the varied structures of data, which is found otherwise. In this paper, we explore the COVID-19 pandemic influence trends in the subcontinent of India in the context of how far the infection rate spiked in the year 2020 and how the public health division of the country India has helped to curb the spread of the novel virus by installing vaccination centers across the diaspora of the country. The paper contributes to the empirical study of understanding the impact caused by the novel virus to the country by doing extensive explanatory data analysis of the data collected from the official government portal. Our work contributes to the understanding that data visualization is prime in understanding public health problems and beyond and taking necessary measures to curb the existing pandemic.
AI Key Findings
Get AI-generated insights about this paper's methodology, results, significance, and more — seven facets brought into focus.
Impact
Paper Details
Authors
PDF Preview
Citation Network
Current paper (gray), citations (green), references (blue)
Display is limited for performance on very large graphs.
Discussion 0