01
MethodologyHow they did it
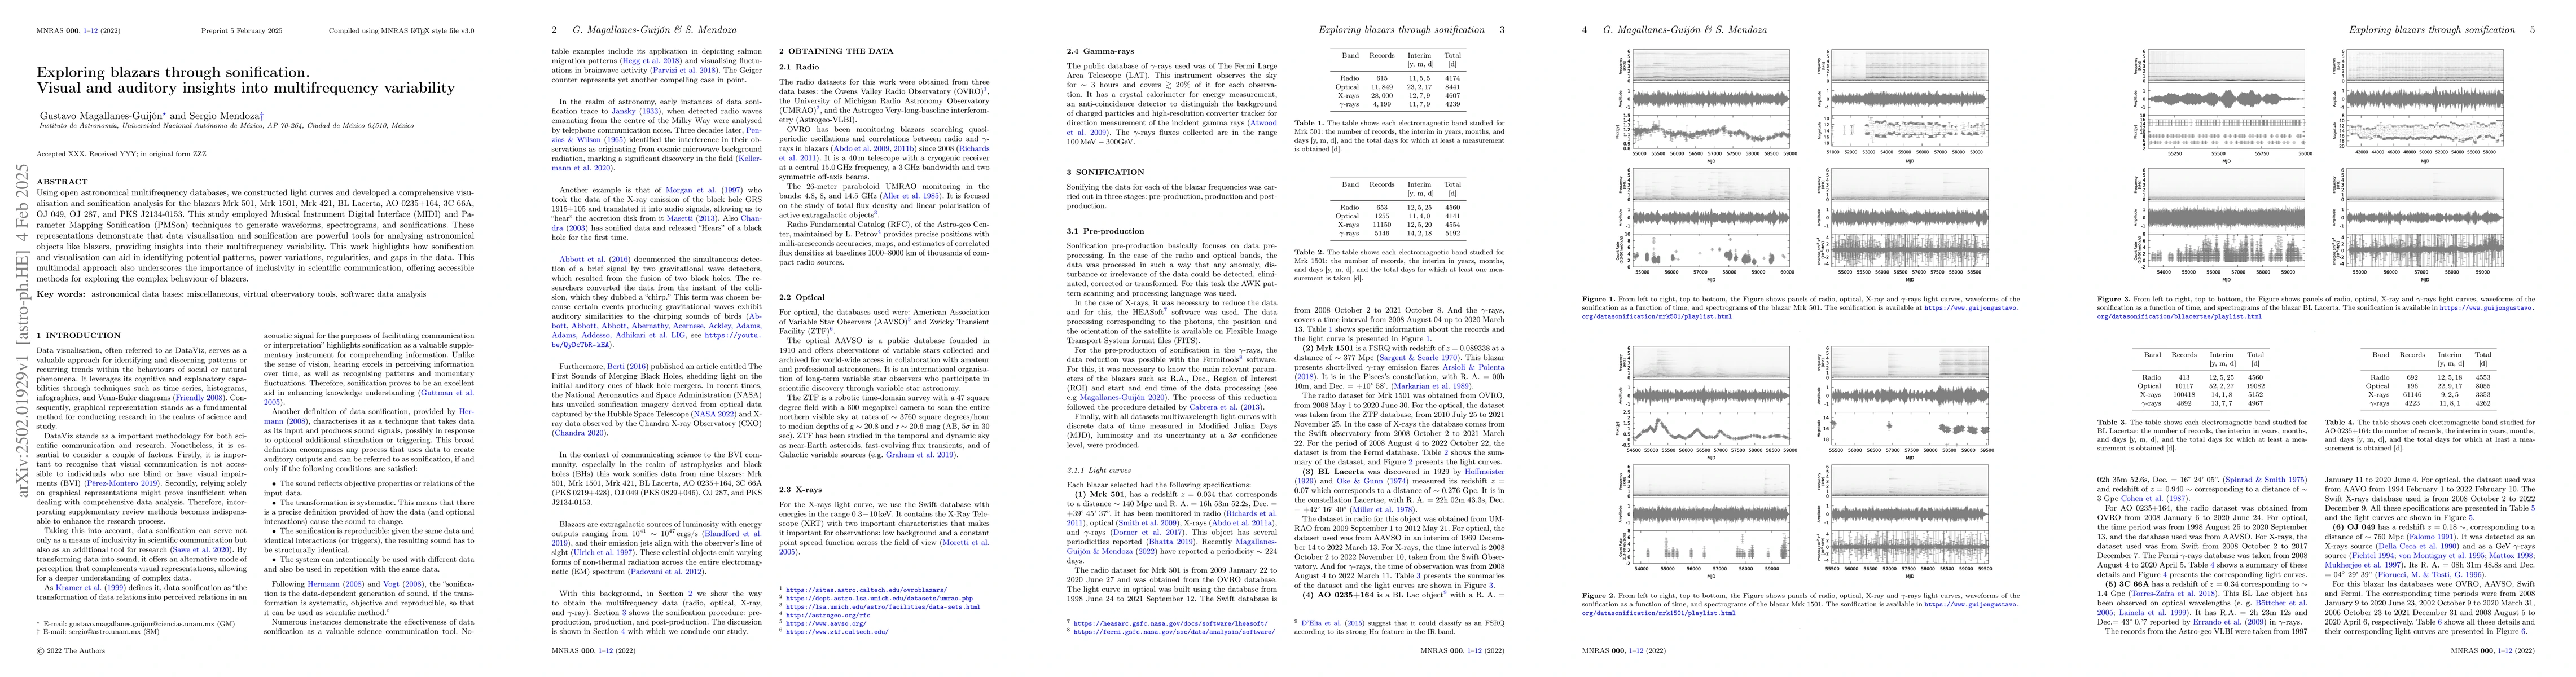
The research utilized open astronomical multifrequency databases to construct light curves for blazars Mrk~501, Mrk~1501, Mrk~421, BL~Lacerta, AO~0235+164, 3C~66A, OJ~049, OJ~287, and PKS~J2134-0153. Musical Instrument Digital Interface (MIDI) and Parameter Mapping Sonification (PMSon) techniques were employed to generate waveforms, spectrograms, and sonifications for data analysis.
Discussion 0