Exploring Case-Control Genetic Association Tests Using Phase Diagrams
Publication
Metrics
AI Quick Summary
Researchers created a 'phase diagram' to compare two genetic tests for case-control studies, finding that using allele frequency and Hardy-Weinberg disequilibrium coefficients can distinguish between the two tests.
Paper Preview
Abstract
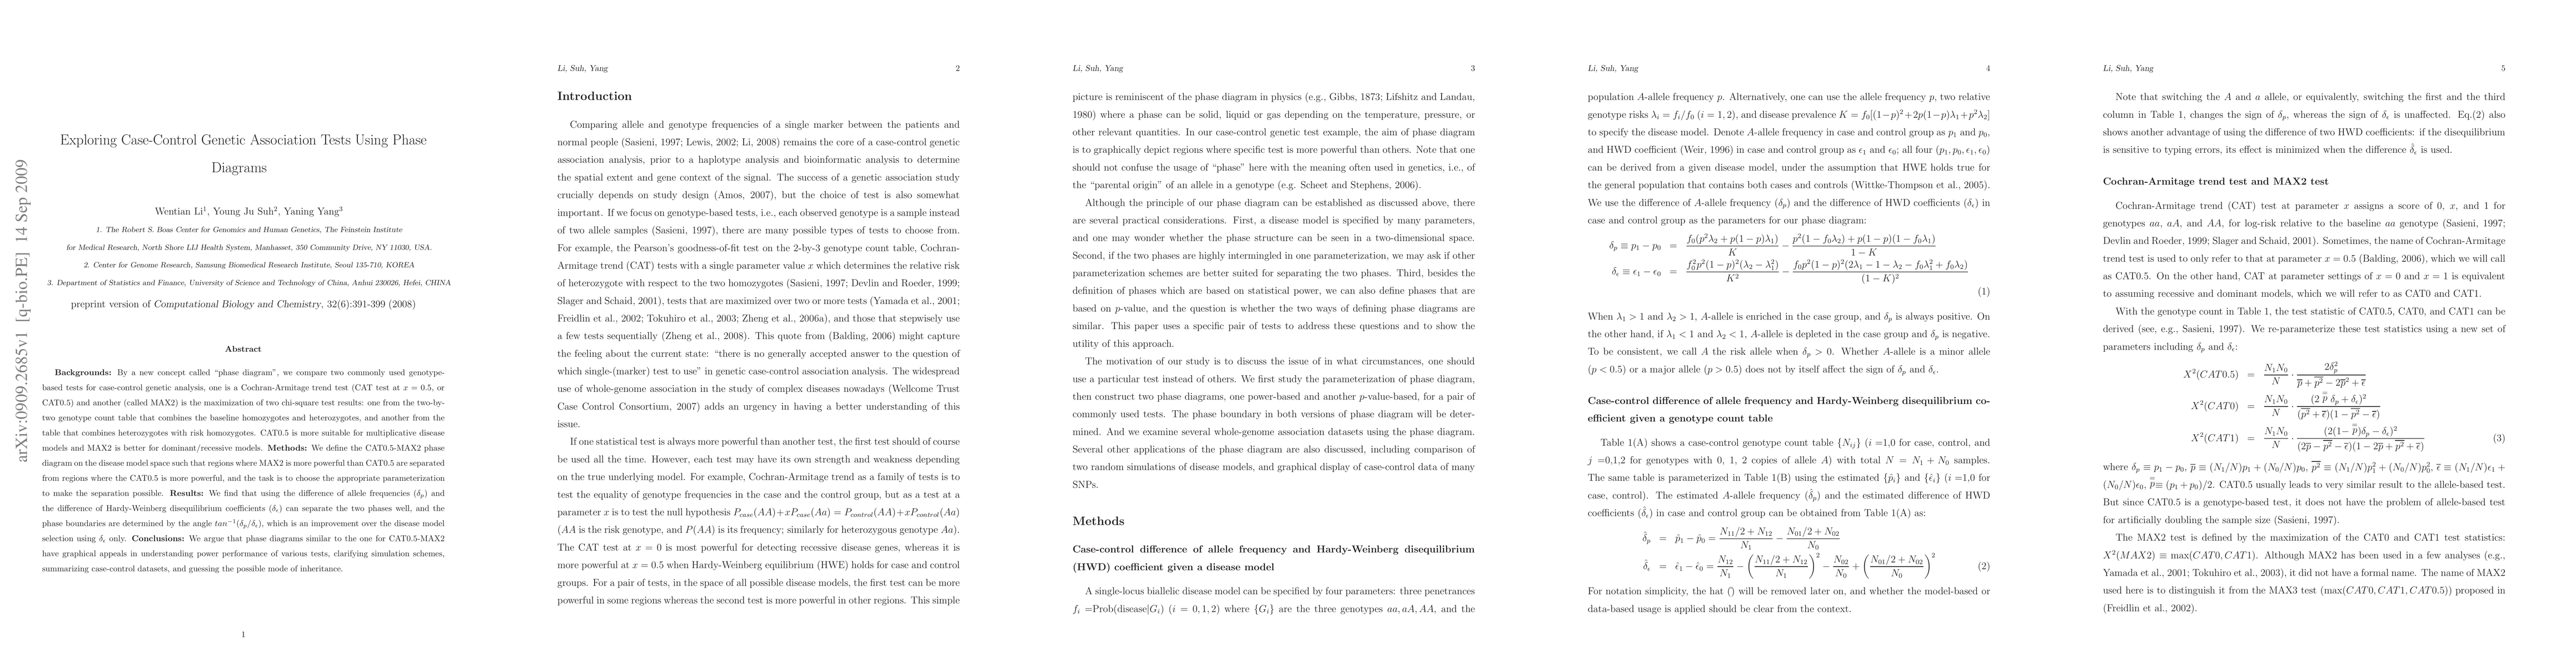
Background: By a new concept called "phase diagram", we compare two commonly used genotype-based tests for case-control genetic analysis, one is a Cochran-Armitage trend test (CAT test at $x=0.5$, or CAT0.5) and another (called MAX2) is the maximization of two chi-square test results: one from the two-by-two genotype count table that combines the baseline homozygotes and heterozygotes, and another from the table that combines heterozygotes with risk homozygotes. CAT0.5 is more suitable for multiplicative disease models and MAX2 is better for dominant/recessive models. Methods: We define the CAT0.5-MAX2 phase diagram on the disease model space such that regions where MAX2 is more powerful than CAT0.5 are separated from regions where the CAT0.5 is more powerful, and the task is to choose the appropriate parameterization to make the separation possible. Results: We find that using the difference of allele frequencies ($\delta_p$) and the difference of Hardy-Weinberg disequilibrium coefficients ($\delta_\epsilon$) can separate the two phases well, and the phase boundaries are determined by the angle $tan^{-1}(\delta_p/\delta_\epsilon)$, which is an improvement over the disease model selection using $\delta_\epsilon$ only. Conclusions: We argue that phase diagrams similar to the one for CAT0.5-MAX2 have graphical appeals in understanding power performance of various tests, clarifying simulation schemes, summarizing case-control datasets, and guessing the possible mode of inheritance.
AI Key Findings
Get AI-generated insights about this paper's methodology, results, significance, and more — seven facets brought into focus.
Impact
Paper Details
PDF Preview
Key Terms
Citation Network
Current paper (gray), citations (green), references (blue)
Display is limited for performance on very large graphs.
Discussion 0