Publication
Metrics
AI Quick Summary
This study uses N-body simulations and galaxy formation models to analyze galaxy clustering, comparing predictions from semi-analytical models and empirical abundance matching methods against observational data. The semi-analytical model overpredicts clustering at small scales, while the abundance matching method aligns well with data for high σ8 cosmologies but not for low σ8. The findings suggest galaxy clustering is heavily influenced by galaxy formation models, complicating cosmology constraints from clustering.
Paper Preview
Abstract
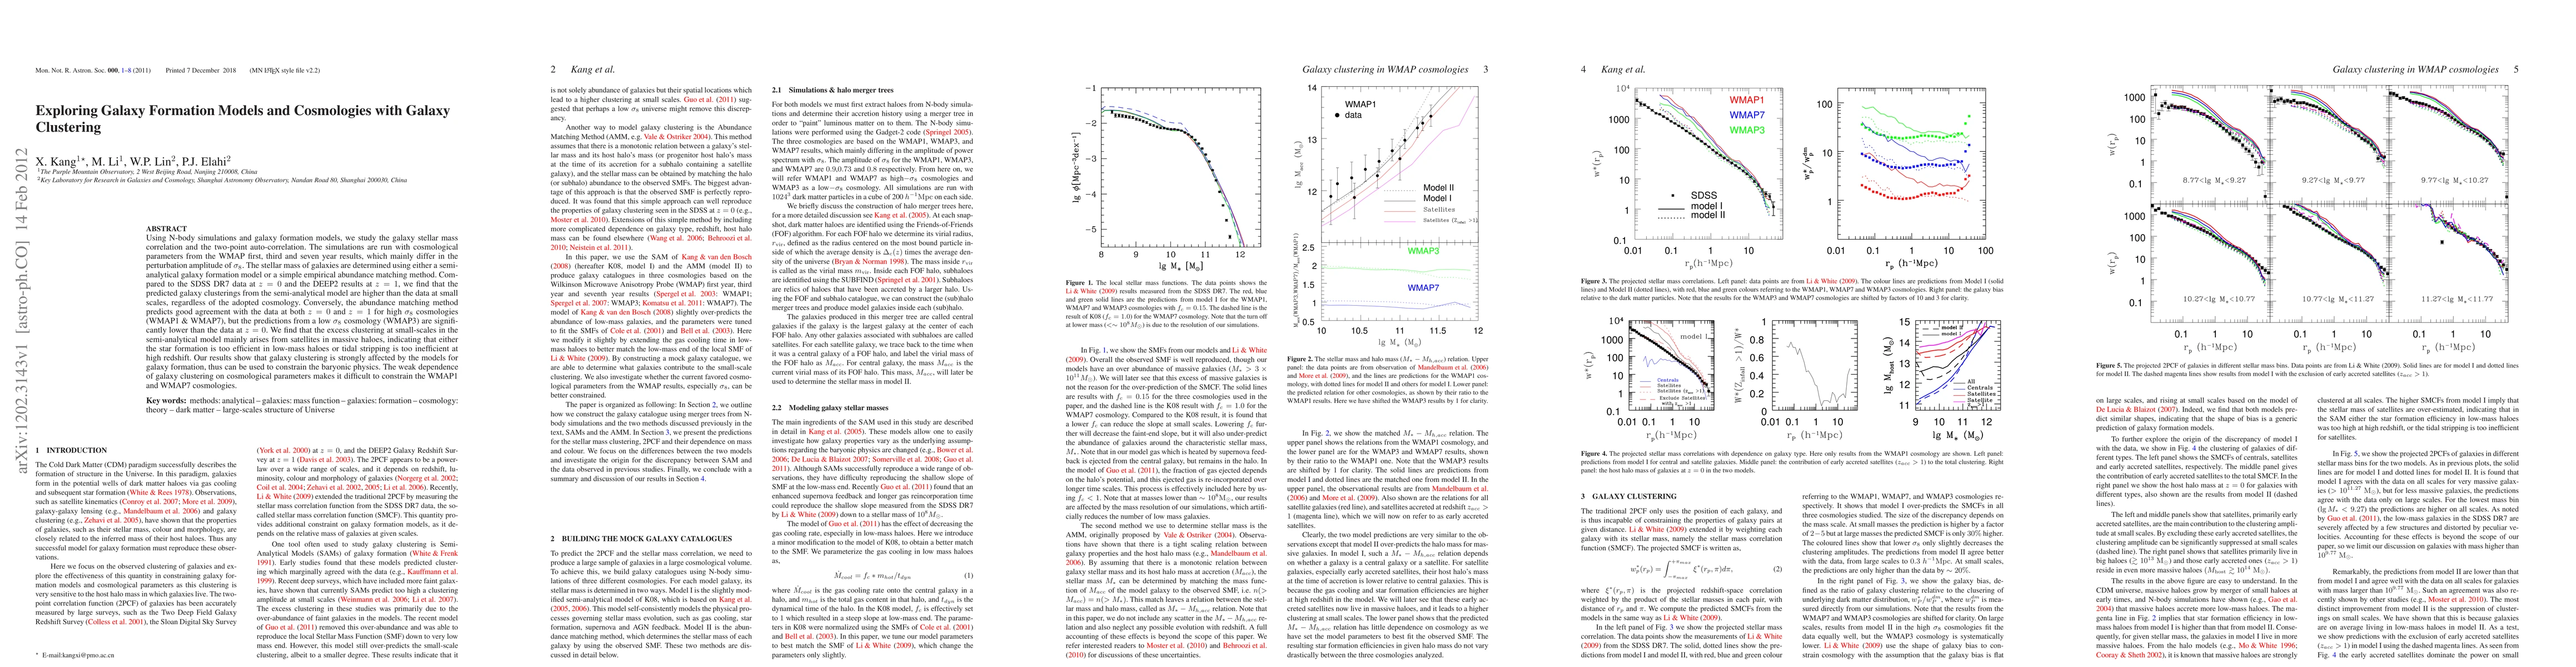
Using N-body simulations and galaxy formation models, we study the galaxy stellar mass correlation and the two-point auto-correlation. The simulations are run with cosmological parameters from the WMAP first, third and seven year results, which mainly differ in the perturbation amplitude of \sigma_{8}. The stellar mass of galaxies are determined using either a semi-analytical galaxy formation model or a simple empirical abundance matching method. Compared to the SDSS DR7 data at z=0 and the DEEP2 results at z=1, we find that the predicted galaxy clusterings from the semi-analytical model are higher than the data at small scales, regardless of the adopted cosmology. Conversely, the abundance matching method predicts good agreement with the data at both z=0 and z=1 for high \sigma_8 cosmologies (WMAP1 & WMAP7), but the predictions from a low \sigma_8 cosmology (WMAP3) are significantly lower than the data at z=0. We find that the excess clustering at small-scales in the semi-analytical model mainly arises from satellites in massive haloes, indicating that either the star formation is too efficient in low-mass haloes or tidal stripping is too inefficient at high redshift. Our results show that galaxy clustering is strongly affected by the models for galaxy formation, thus can be used to constrain the baryonic physics. The weak dependence of galaxy clustering on cosmological parameters makes it difficult to constrain the WMAP1 and WMAP7 cosmologies.
AI Key Findings
Get AI-generated insights about this paper's methodology, results, significance, and more — seven facets brought into focus.
Impact
Paper Details
PDF Preview
Key Terms
Citation Network
Current paper (gray), citations (green), references (blue)
Display is limited for performance on very large graphs.
Discussion 0