Authors
Summary
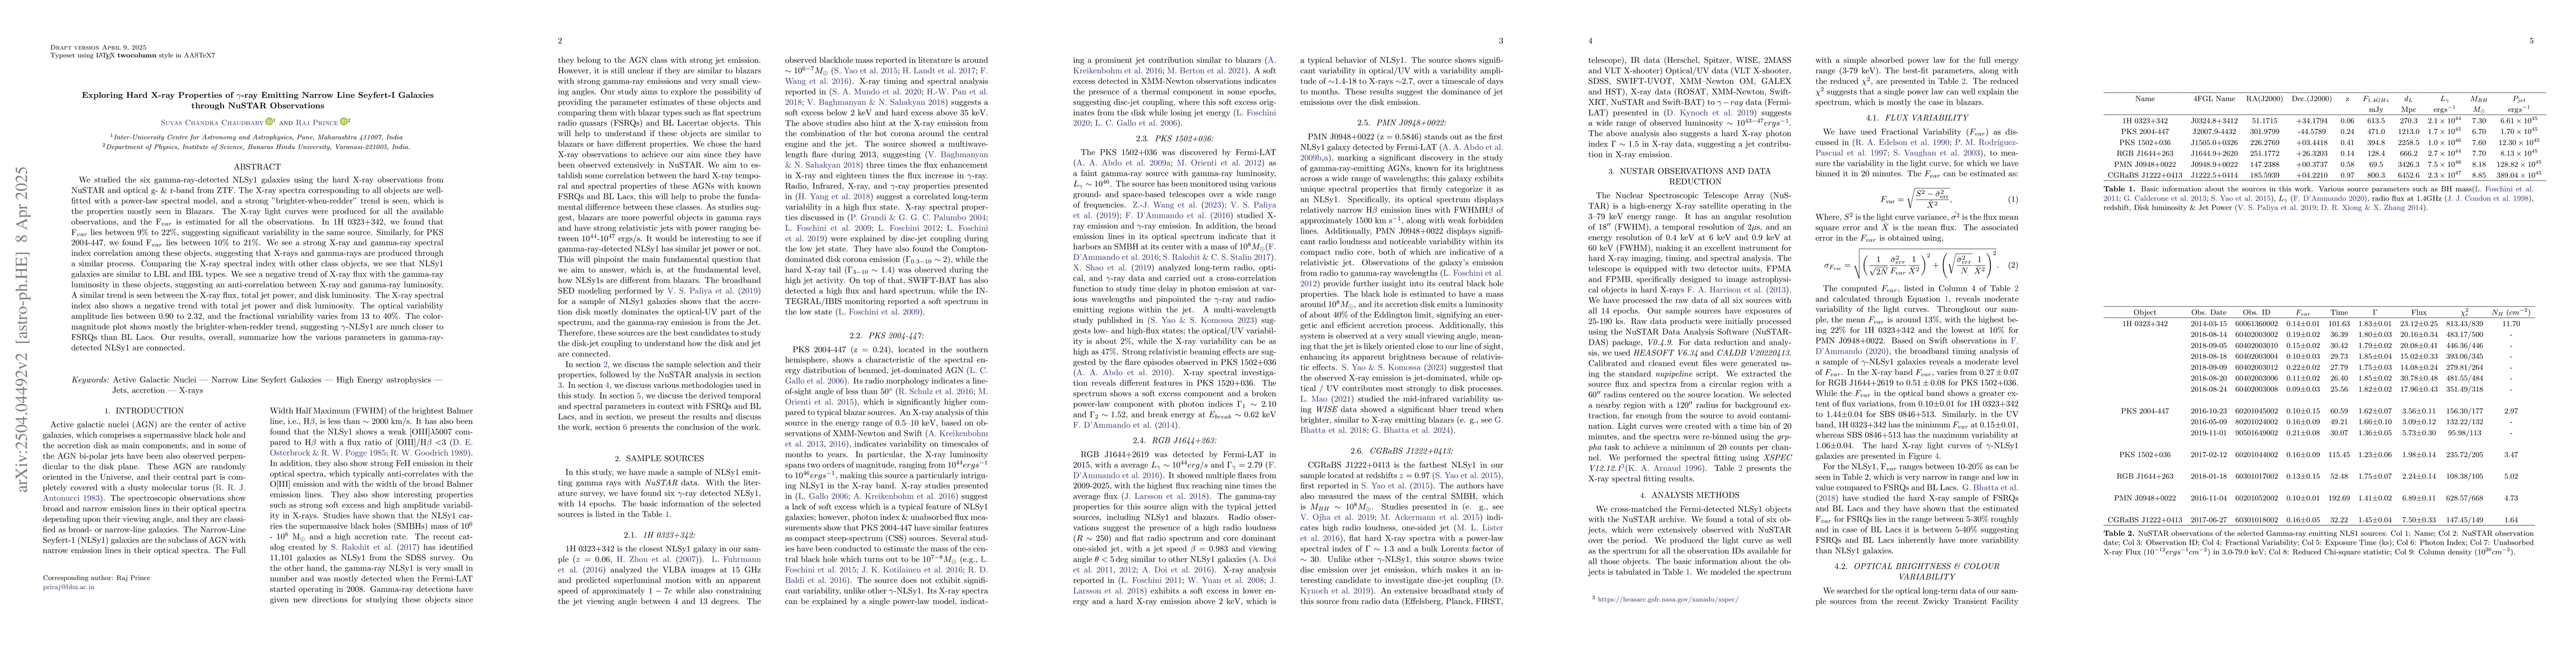
With the launch of the Fermi-LAT observatory in 2008, more new gamma-ray objects were discovered, mostly dominated by blazars. In addition, some of the narrow line Seyfert 1 (NLSy1) galaxies were observed in gamma-ray but in less number, making them different from other NLSy1 galaxies. We studied the six gamma-ray-detected NLSy1 galaxies using the hard X-ray observations from NuSTAR and optical g- & r-band from ZTF. The X-ray spectra corresponding to all objects are well-fitted with a power-law spectral model, and a strong "brighter-when-redder" trend is seen, which is the properties mostly seen in Blazars. The X-ray light curves were produced for all the available observations, and the F$_{var}$ is estimated for all the observations. In 1H 0323+342, we found that F$_{var}$ lies between 9-22%, suggesting significant variability in the same source. Similarly, for PKS 2004-447, we found F$_{var}$ lies between 10-21%. We see a strong X-ray and gamma-ray spectral index correlation among these objects, suggesting that X-rays and gamma-rays are produced through a similar process. Comparing the X-ray spectral index with other class objects, we see that NLSy1 galaxies are similar to LBL and IBL types. We see a negative trend of X-ray flux with the gamma-ray luminosity in these objects, suggesting an anti-correlation between X-ray and gamma-ray luminosity. A similar trend is seen between the X-ray flux, total jet power, and disk luminosity. The X-ray spectral index also shows a negative trend with total jet power and disk luminosity. The optical variability amplitude lies between 0.90 to 2.32, and the fractional variability varies from 13-40%. The color-magnitude plot shows mostly the brighter-when-redder trend, suggesting $\gamma$-NLSy1 are much closer to FSRQs than BL Lacs. Our results, overall, summarize how the various parameters in gamma-ray-detected NLSy1 are connected.
AI Key Findings
Generated Jun 10, 2025
Methodology
The study utilized NuSTAR for hard X-ray observations and ZTF for optical g- & r-band data of six gamma-ray-detected NLSy1 galaxies, analyzing their X-ray spectra, light curves, and variability.
Key Results
- All objects exhibit X-ray spectra well-fitted by a power-law model with a strong 'brighter-when-redder' trend, similar to Blazars.
- Significant variability was found in 1H 0323+342 and PKS 2004-447 with Fvar ranging from 9-22% and 10-21% respectively.
- A strong correlation was observed between X-ray and gamma-ray spectral indices, suggesting a common production process for X-rays and gamma-rays.
- A negative trend was identified between X-ray flux and gamma-ray luminosity, as well as with total jet power and disk luminosity.
- Optical variability amplitude ranged from 0.90 to 2.32, with fractional variability varying from 13-40%.
Significance
This research provides insights into the connection between various parameters in gamma-ray-detected NLSy1 galaxies, helping to understand the emission mechanisms in these objects and their relation to Blazars.
Technical Contribution
Detailed hard X-ray analysis of gamma-ray-emitting NLSy1 galaxies using NuSTAR, revealing connections between X-ray, gamma-ray, and optical variability.
Novelty
This work distinguishes itself by examining the hard X-ray properties of gamma-ray-detected NLSy1 galaxies, uncovering similarities to Blazar types, and identifying correlations between X-ray, gamma-ray, and optical variability.
Limitations
- The study is limited to a small sample size of six gamma-ray-detected NLSy1 galaxies.
- Further multi-wavelength studies are required to confirm and extend the findings.
Future Work
- Expanding the sample size and conducting multi-wavelength studies to validate and extend the results.
- Investigating the physical processes behind the observed correlations and anti-correlations.
Paper Details
PDF Preview
Citation Network
Current paper (gray), citations (green), references (blue)
Display is limited for performance on very large graphs.
Similar Papers
Found 4 papersNo citations found for this paper.
Comments (0)