01
MethodologyHow they did it
DeepVATS is a powerful tool designed for easy visual analysis of univariate and multivariate time series.
This paper introduces DeepVATS, a framework combining Deep Learning and Visual Analytics for large time series analysis. It examines the tool's scalability by analyzing execution time as time series length varies, using log analytics to determine performance efficiency.
This paper introduces DeepVATS, a framework combining Deep Learning and Visual Analytics for large time series analysis. It examines the tool's scalability by analyzing execution time as time series length varies, using log analytics to determine performance efficiency.
DeepVATS is a powerful tool designed for easy visual analysis of univariate and multivariate time series. More in Methodology →
Main finding 1: DeepVATS performs well on small to medium-sized datasets (up to 493.1K elements) — Main finding 2: Performance issues appear when processing larger datasets, with noticeable degradation at 3.7M elements More in Key Results →
DeepVATS enhances usability for large datasets by proposing the elimination of redundant processes and suggesting alternative dimensionality reduction strategies. More in Significance →
Limitation 1: Redundant processes in certain operations affect performance — Limitation 2: Application crashes occur at extremely large dataset sizes More in Limitations →
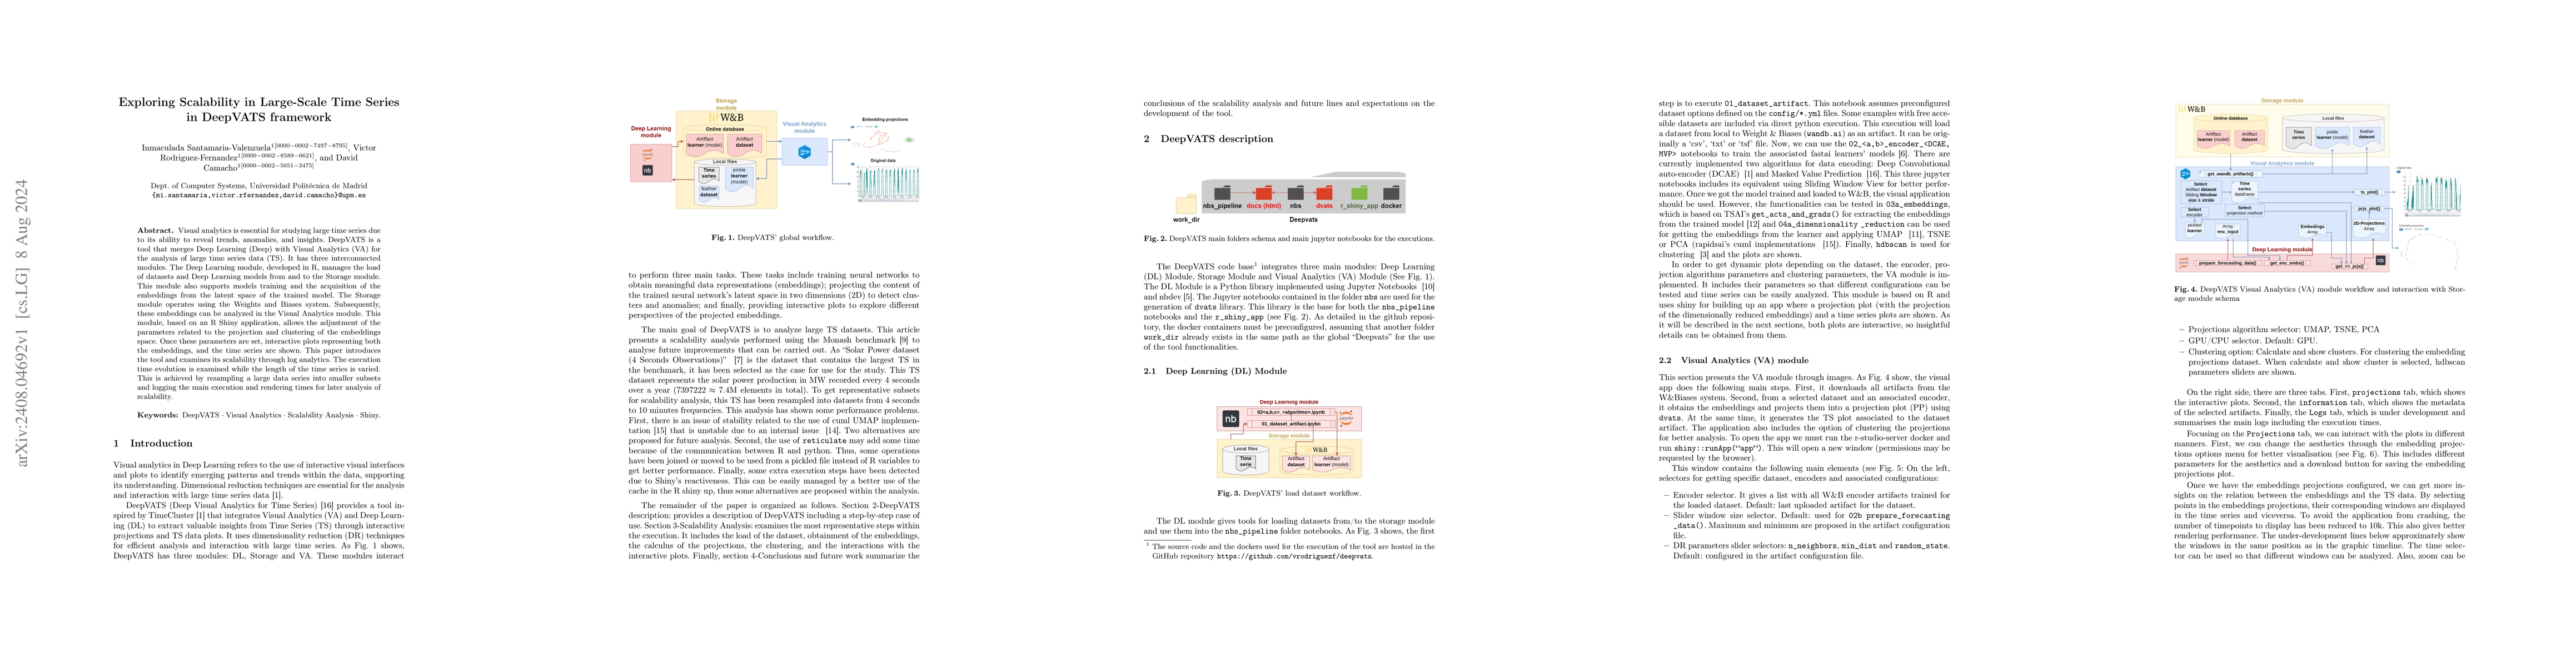
Visual analytics is essential for studying large time series due to its ability to reveal trends, anomalies, and insights. DeepVATS is a tool that merges Deep Learning (Deep) with Visual Analytics (VA) for the analysis of large time series data (TS). It has three interconnected modules. The Deep Learning module, developed in R, manages the load of datasets and Deep Learning models from and to the Storage module. This module also supports models training and the acquisition of the embeddings from the latent space of the trained model. The Storage module operates using the Weights and Biases system. Subsequently, these embeddings can be analyzed in the Visual Analytics module. This module, based on an R Shiny application, allows the adjustment of the parameters related to the projection and clustering of the embeddings space. Once these parameters are set, interactive plots representing both the embeddings, and the time series are shown. This paper introduces the tool and examines its scalability through log analytics. The execution time evolution is examined while the length of the time series is varied. This is achieved by resampling a large data series into smaller subsets and logging the main execution and rendering times for later analysis of scalability.
Seven facets of this paper, analysed and brought into focus by AI.
DeepVATS enhances usability for large datasets by proposing the elimination of redundant processes and suggesting alternative dimensionality reduction strategies.
DeepVATS is a powerful tool designed for easy visual analysis of univariate and multivariate time series.
DeepVATS enhances usability for large datasets by proposing the elimination of redundant processes and suggesting alternative dimensionality reduction strategies.
Main technical contribution is the development of DeepVATS, which provides a robust tool for visual and interactive analysis of time series.
DeepVATS offers novel approaches to handling large datasets and improving performance through reactive variable conversion and alternative dimensionality reduction strategies
Current paper (gray), citations (green), references (blue)
Display is limited for performance on very large graphs.
Discussion 0