Exploring Short-Term Optical Variability of Blazars Using $\textit{TESS}$
Publication
Metrics
AI Quick Summary
This study systematically investigates the short-term optical variability of 29 blazars observed by the TESS spacecraft, revealing significant variability and bi-modal flux distributions, suggesting contributions from two distinct emission zones or activity states. Power spectral density analysis found slopes ranging from 1.7 to 3.2, indicating complex variability patterns.
Paper Preview
Abstract
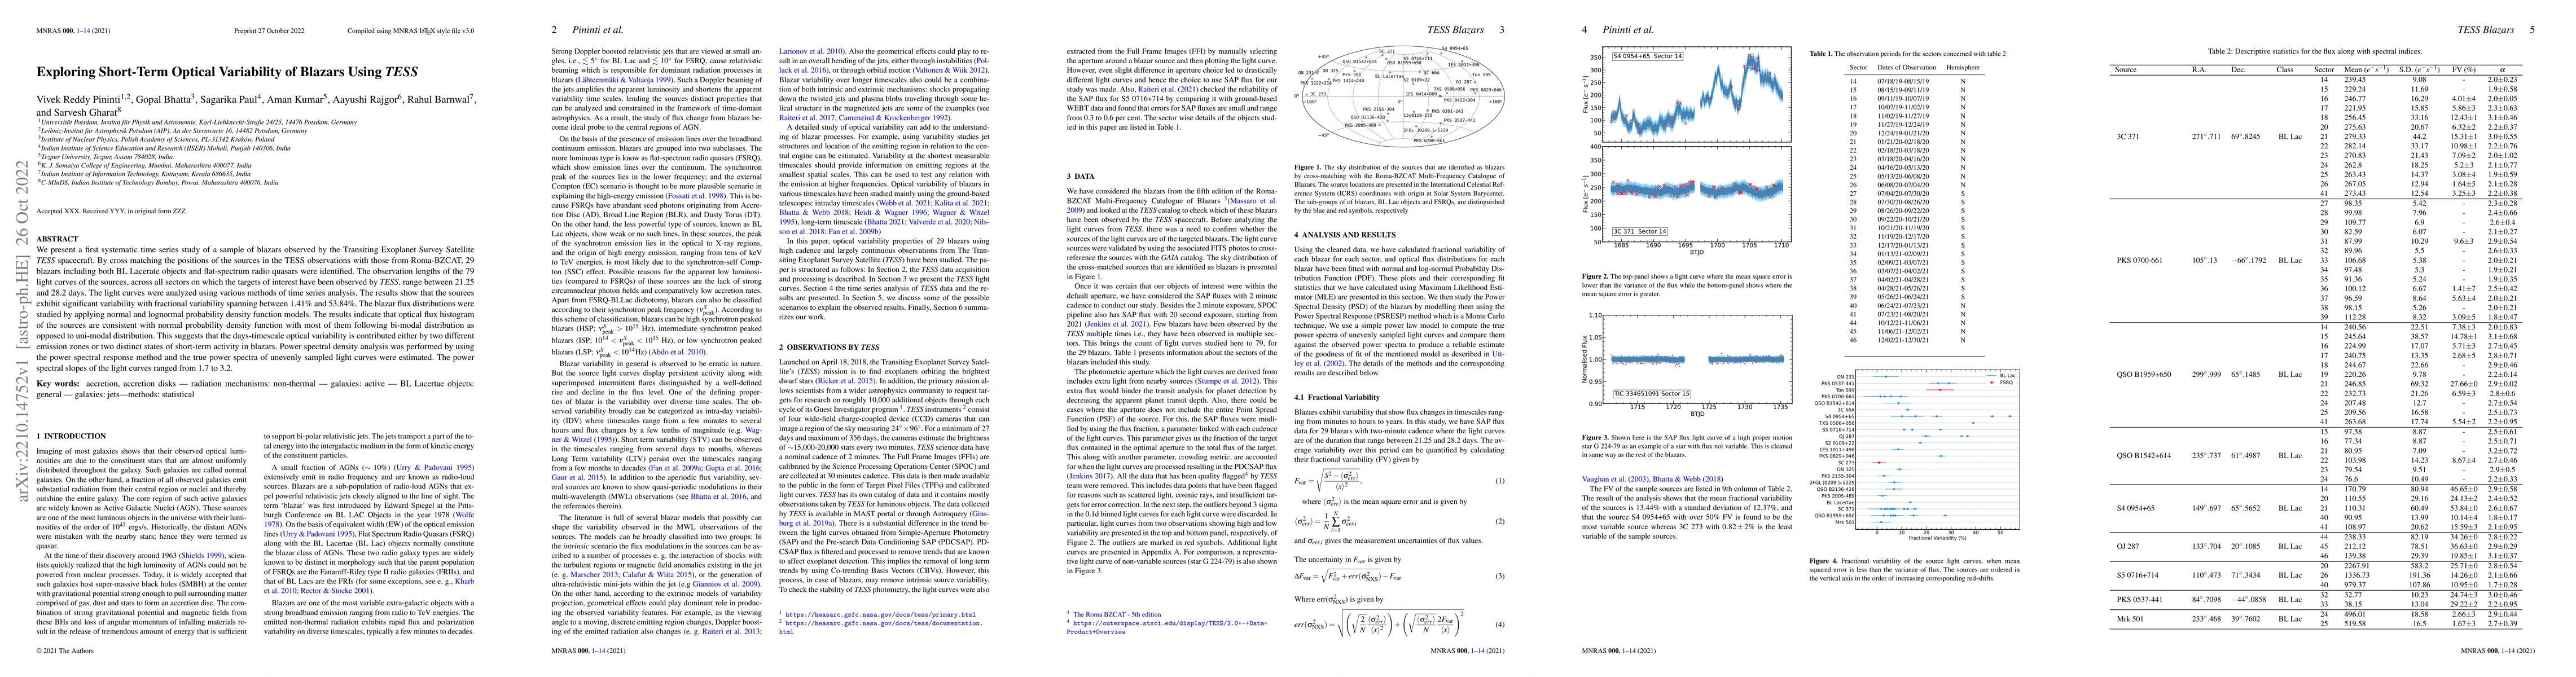
We present a first systematic time series study of a sample of blazars observed by the Transiting Exoplanet Survey Satellite $\textit{TESS}$ spacecraft. By cross matching the positions of the sources in the TESS observations with those from Roma-BZCAT, 29 blazars including both BL Lacerate objects and flat-spectrum radio quasars were identified. The observation lengths of the 79 light curves of the sources, across all sectors on which the targets of interest have been observed by $\textit{TESS}$, range between 21.25 and 28.2 days. The light curves were analyzed using various methods of time series analysis. The results show that the sources exhibit significant variability with fractional variability spanning between 1.41% and 53.84%. The blazar flux distributions were studied by applying normal and lognormal probability density function models. The results indicate that optical flux histogram of the sources are consistent with normal probability density function with most of them following bi-modal distribution as opposed to uni-modal distribution. This suggests that the days-timescale optical variability is contributed either by two different emission zones or two distinct states of short-term activity in blazars. Power spectral density analysis was performed by using the power spectral response method and the true power spectra of unevenly sampled light curves were estimated. The power spectral slopes of the light curves ranged from 1.7 to 3.2.
AI Key Findings
Get AI-generated insights about this paper's methodology, results, significance, and more — seven facets brought into focus.
Impact
Paper Details
Authors
PDF Preview
Key Terms
Citation Network
Current paper (gray), citations (green), references (blue)
Display is limited for performance on very large graphs.
Discussion 0