Exploring the difficulty of estimating win probability: a simulation study
Publication
Metrics
AI Quick Summary
This paper investigates the challenges in estimating win probability using statistical models through a simulation study of a simplified football model. It finds that play-by-play data's dependence structure increases bias and variance, necessitating better uncertainty quantification, and proposes a fractional bootstrap method to improve confidence interval calibration.
Paper Preview
Abstract
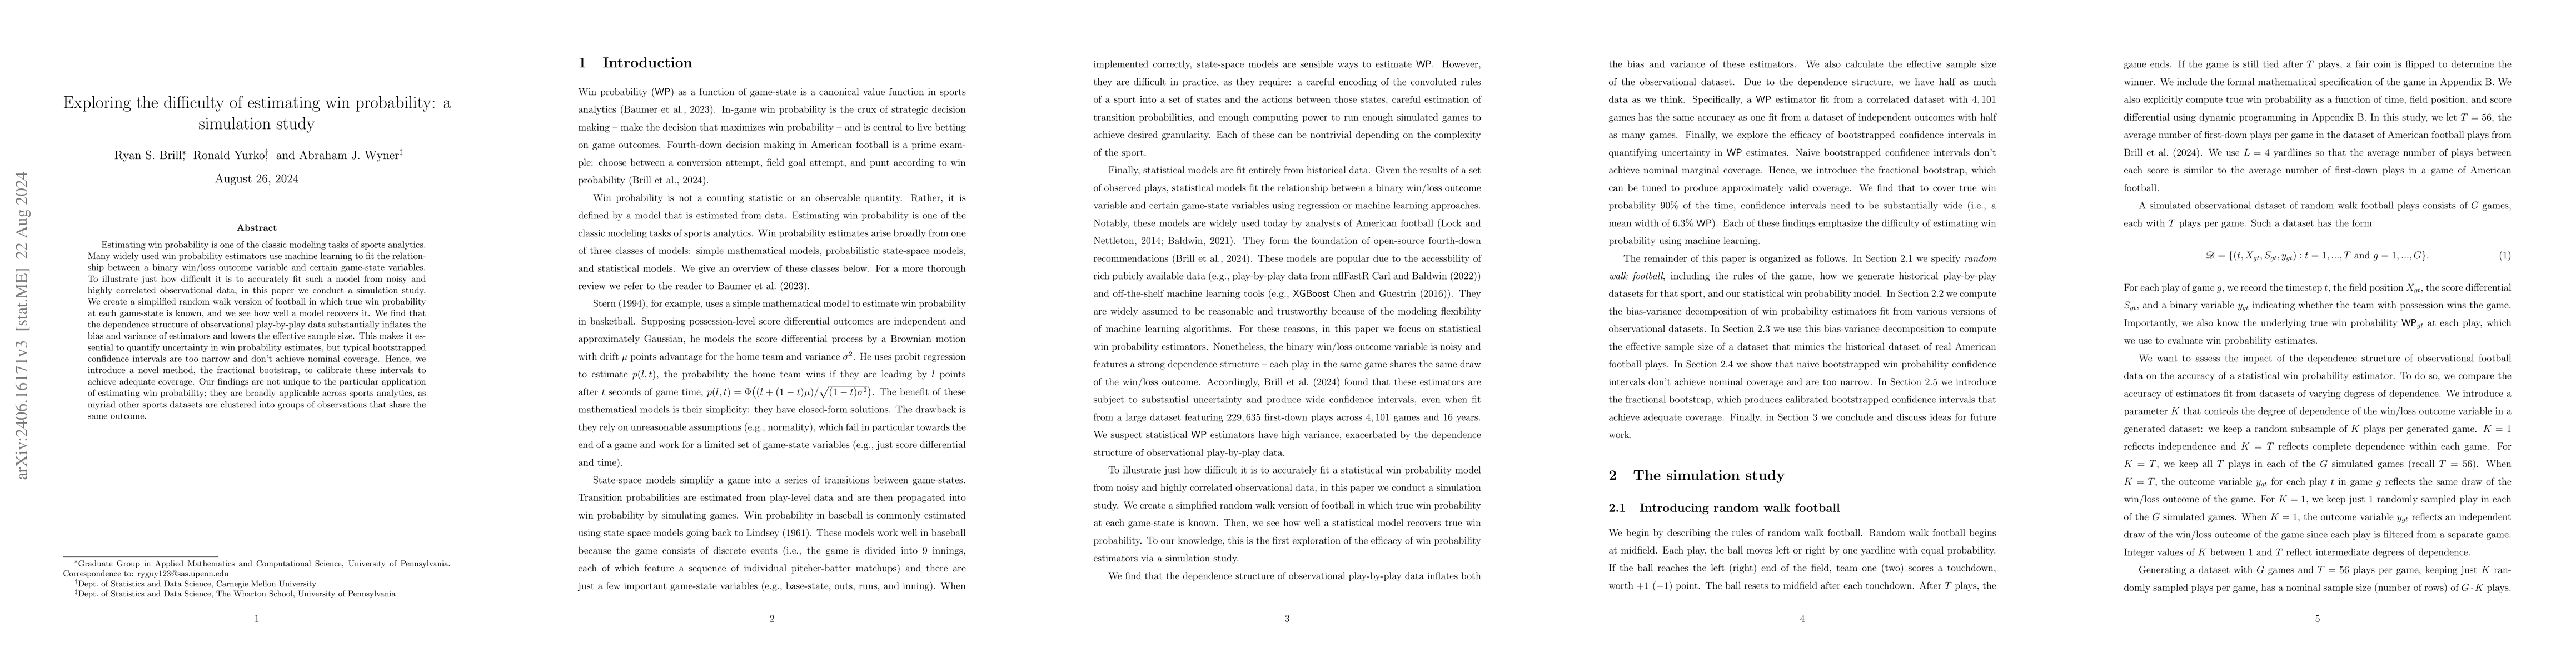
Estimating win probability is one of the classic modeling tasks of sports analytics. Many widely used win probability estimators are statistical win probability models, which fit the relationship between a binary win/loss outcome variable and certain game-state variables using data-driven regression or machine learning approaches. To illustrate just how difficult it is to accurately fit a statistical win probability model from noisy and highly correlated observational data, in this paper we conduct a simulation study. We create a simplified random walk version of football in which true win probability at each game-state is known, and we see how well a model recovers it. We find that the dependence structure of observational play-by-play data substantially inflates the bias and variance of estimators and lowers the effective sample size. This makes it essential to quantify uncertainty in win probability estimates, but typical bootstrapped confidence intervals are too narrow and don't achieve nominal coverage. Hence, we introduce a novel method, the fractional bootstrap, to calibrate these intervals to achieve adequate coverage.
AI Key Findings
Get AI-generated insights about this paper's methodology, results, significance, and more — seven facets brought into focus.
Impact
Paper Details
Authors
PDF Preview
Key Terms
Citation Network
Current paper (gray), citations (green), references (blue)
Display is limited for performance on very large graphs.
Discussion 0