Exploring the Impact of Outlier Variability on Anomaly Detection Evaluation Metrics
Publication
Metrics
AI Quick Summary
This study investigates the performance of three anomaly detection metrics—F1 score, ROC AUC, and AUCPR—under varying outlier levels, finding that ROC AUC remains consistent while F1 score and AUCPR are sensitive to outlier variability. These insights enhance the understanding of metric selection in anomaly detection.
Paper Preview
Abstract
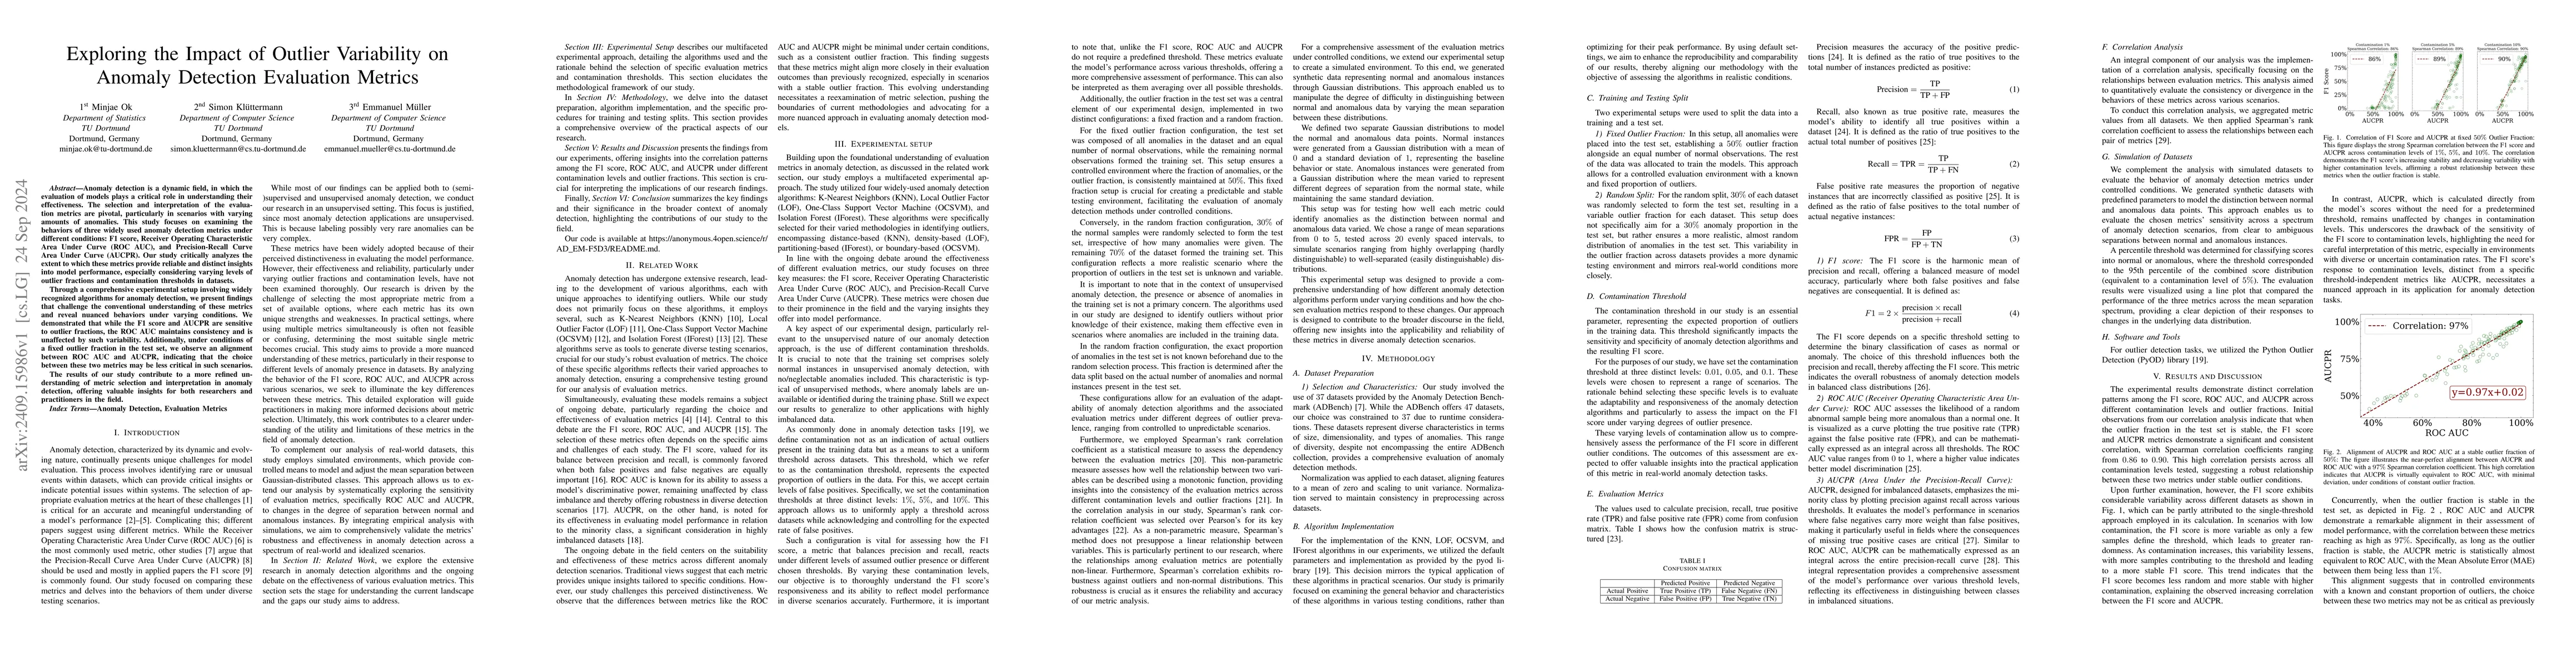
Anomaly detection is a dynamic field, in which the evaluation of models plays a critical role in understanding their effectiveness. The selection and interpretation of the evaluation metrics are pivotal, particularly in scenarios with varying amounts of anomalies. This study focuses on examining the behaviors of three widely used anomaly detection metrics under different conditions: F1 score, Receiver Operating Characteristic Area Under Curve (ROC AUC), and Precision-Recall Curve Area Under Curve (AUCPR). Our study critically analyzes the extent to which these metrics provide reliable and distinct insights into model performance, especially considering varying levels of outlier fractions and contamination thresholds in datasets. Through a comprehensive experimental setup involving widely recognized algorithms for anomaly detection, we present findings that challenge the conventional understanding of these metrics and reveal nuanced behaviors under varying conditions. We demonstrated that while the F1 score and AUCPR are sensitive to outlier fractions, the ROC AUC maintains consistency and is unaffected by such variability. Additionally, under conditions of a fixed outlier fraction in the test set, we observe an alignment between ROC AUC and AUCPR, indicating that the choice between these two metrics may be less critical in such scenarios. The results of our study contribute to a more refined understanding of metric selection and interpretation in anomaly detection, offering valuable insights for both researchers and practitioners in the field.
AI Key Findings
Get AI-generated insights about this paper's methodology, results, significance, and more — seven facets brought into focus.
Impact
Paper Details
Authors
PDF Preview
Citation Network
Current paper (gray), citations (green), references (blue)
Display is limited for performance on very large graphs.
Discussion 0