Summary
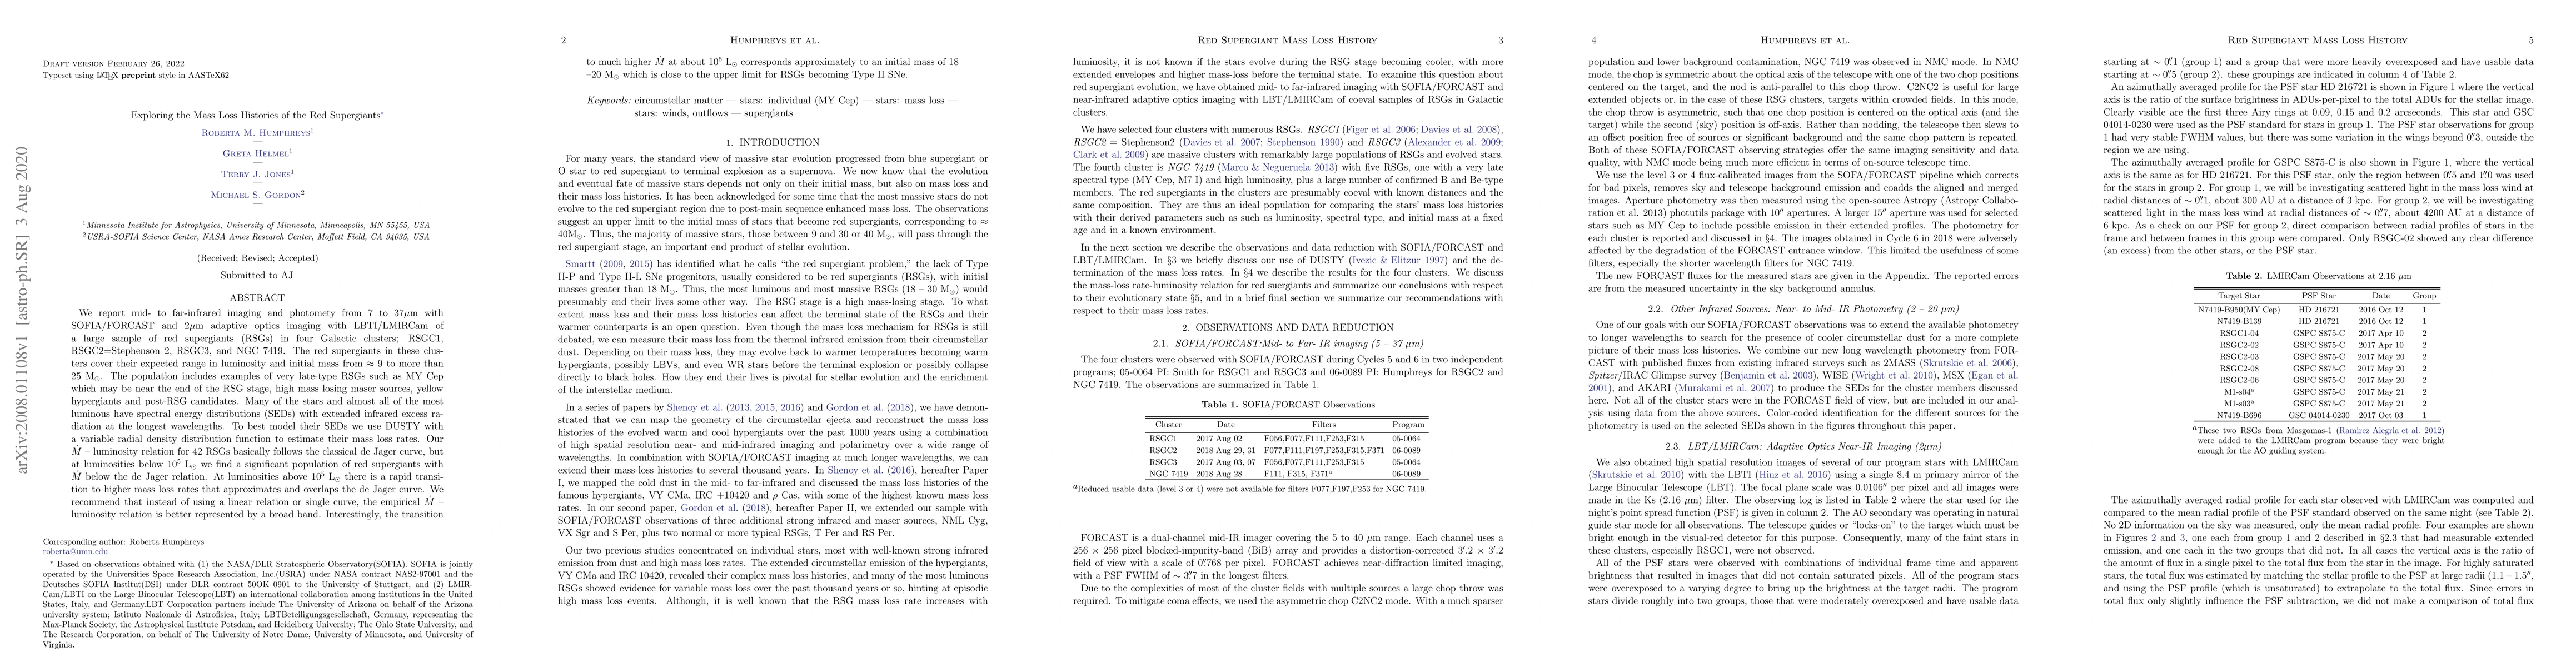
We report mid- to far-infrared imaging and photomety from 7 to 37 microns with SOFIA/FORCAST and 2 micron adaptive optics imaging with LBTI/LMIRCam of a large sample of red supergiants (RSGs) in four Galactic clusters; RSGC1, RSGC2=Stephenson 2, RSGC3, and NGC 7419. The red supergiants in these clusters cover their expected range in luminosity and initial mass from approximately 9 to more than 25 Solar masses. The population includes examples of very late-type RSGs such as MY Cep which may be near the end of the RSG stage, high mass losing maser sources, yellow hypergiants and post-RSG candidates. Many of the stars and almost all of the most luminous have spectral energy distributions (SEDs) with extended infrared excess radiation at the longest wavelengths. To best model their SEDs we use DUSTY with a variable radial density distribution function to estimate their mass loss rates. Our mass loss rate -- luminosity relation for 42 RSGs basically follows the classical de Jager curve, but at luminosities below 10^5 Solar luminosities we find a significant population of red supergiants with mass loss rate below the de Jager relation. At luminosities above 10^5 Solar luminosities there is a rapid transition to higher mass loss rates that approximates and overlaps the de Jager curve. We recommend that instead of using a linear relation or single curve, the empirical mass loss rate -- luminosity relation is better represented by a broad band. Interestingly, the transition to much higher mass loss rates at about 10^5 Lsun corresponds approximately to an initial mass of 18 --20 Msun which is close to the upper limit for RSGs becoming Type II SNe.
AI Key Findings
Get AI-generated insights about this paper's methodology, results, and significance.
Paper Details
PDF Preview
Key Terms
Citation Network
Current paper (gray), citations (green), references (blue)
Display is limited for performance on very large graphs.
Similar Papers
Found 4 papersEpisodic Gaseous Outflows and Mass Loss from Red Supergiants
Roberta M. Humphreys, Terry J. Jones
Boil-off of red supergiants: mass loss and type II-P supernovae
Daichi Tsuna, Jim Fuller
| Title | Authors | Year | Actions |
|---|
Comments (0)