Publication
Metrics
AI Quick Summary
Researchers mapped galaxy colours to redshifts without assuming their spectral energy distributions, revealing a smoother distribution with no structure in redshift space, and identifying star-forming galaxies and AGN.
Paper Preview
Abstract
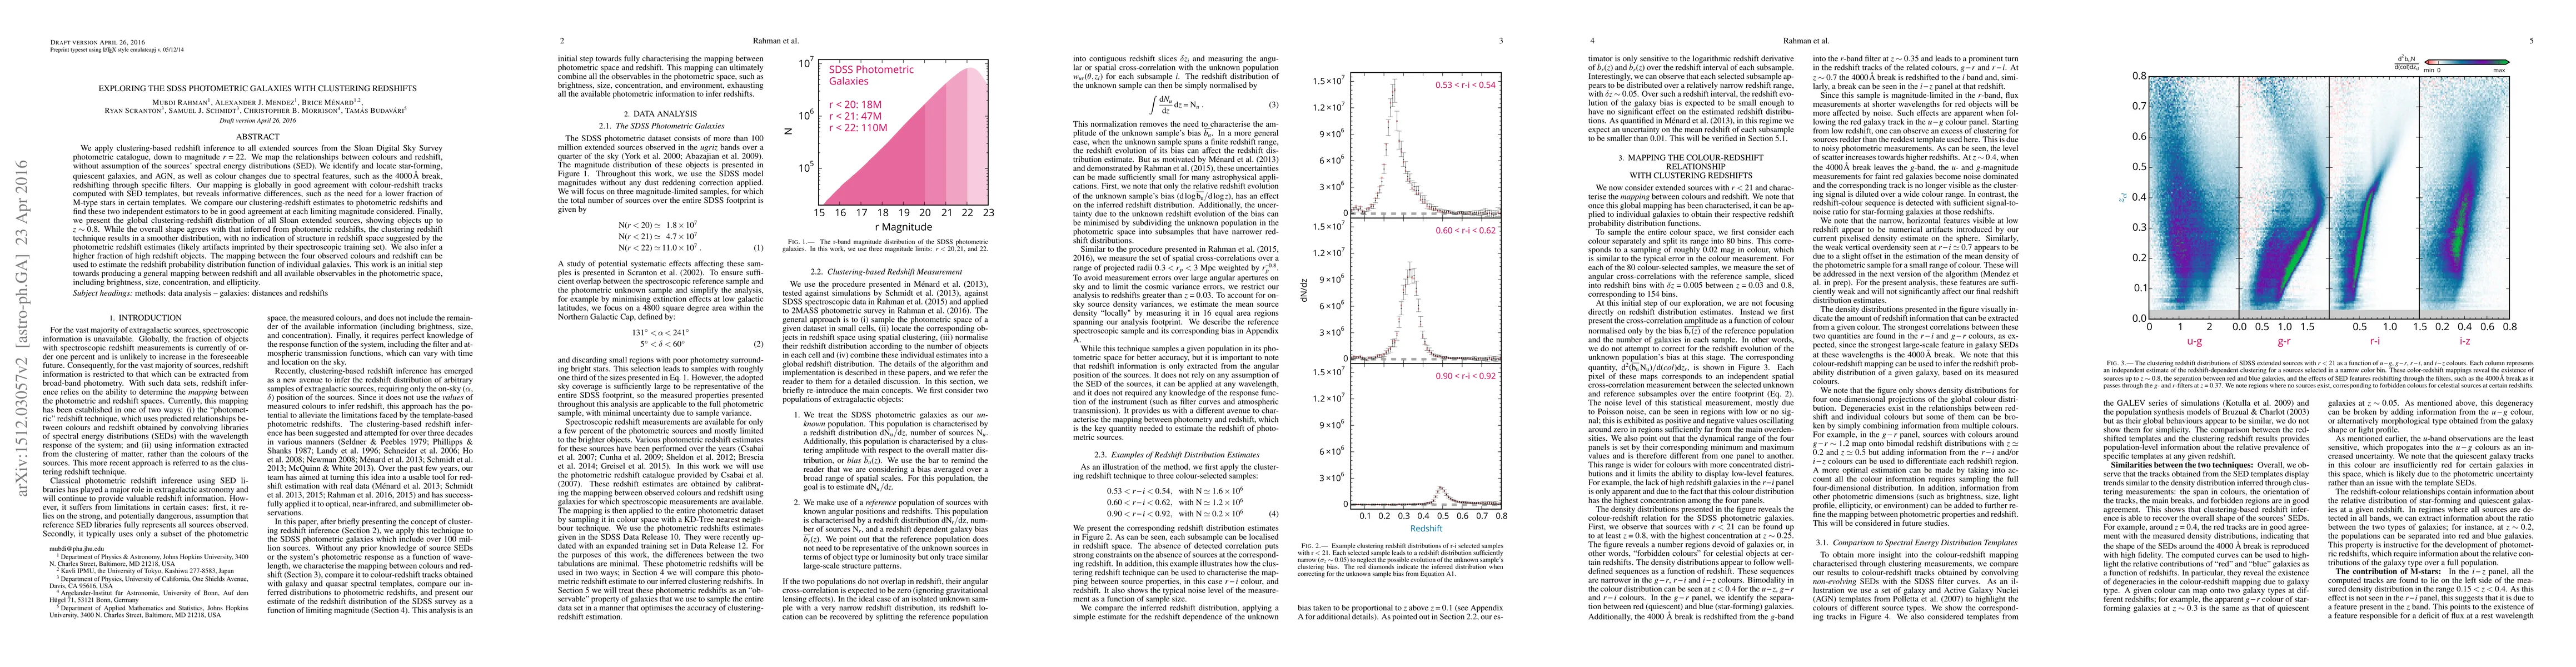
We apply clustering-based redshift inference to all extended sources from the Sloan Digital Sky Survey photometric catalogue, down to magnitude r = 22. We map the relationships between colours and redshift, without assumption of the sources' spectral energy distributions (SED). We identify and locate star-forming, quiescent galaxies, and AGN, as well as colour changes due to spectral features, such as the 4000 \AA{} break, redshifting through specific filters. Our mapping is globally in good agreement with colour-redshift tracks computed with SED templates, but reveals informative differences, such as the need for a lower fraction of M-type stars in certain templates. We compare our clustering-redshift estimates to photometric redshifts and find these two independent estimators to be in good agreement at each limiting magnitude considered. Finally, we present the global clustering-redshift distribution of all Sloan extended sources, showing objects up to z ~ 0.8. While the overall shape agrees with that inferred from photometric redshifts, the clustering redshift technique results in a smoother distribution, with no indication of structure in redshift space suggested by the photometric redshift estimates (likely artifacts imprinted by their spectroscopic training set). We also infer a higher fraction of high redshift objects. The mapping between the four observed colours and redshift can be used to estimate the redshift probability distribution function of individual galaxies. This work is an initial step towards producing a general mapping between redshift and all available observables in the photometric space, including brightness, size, concentration, and ellipticity.
AI Key Findings
Get AI-generated insights about this paper's methodology, results, significance, and more — seven facets brought into focus.
Impact
Paper Details
PDF Preview
Key Terms
Citation Network
Current paper (gray), citations (green), references (blue)
Display is limited for performance on very large graphs.
Discussion 0