Expressing Multivariate Time Series as Graphs with Time Series Attention Transformer
Publication
Metrics
AI Quick Summary
The paper proposes the Time Series Attention Transformer (TSAT) to represent multivariate time series as edge-enhanced dynamic graphs, capturing temporal and inter-variable dependencies. TSAT outperforms six state-of-the-art baselines in forecasting tasks, as demonstrated through experiments on four datasets.
Paper Preview
Abstract
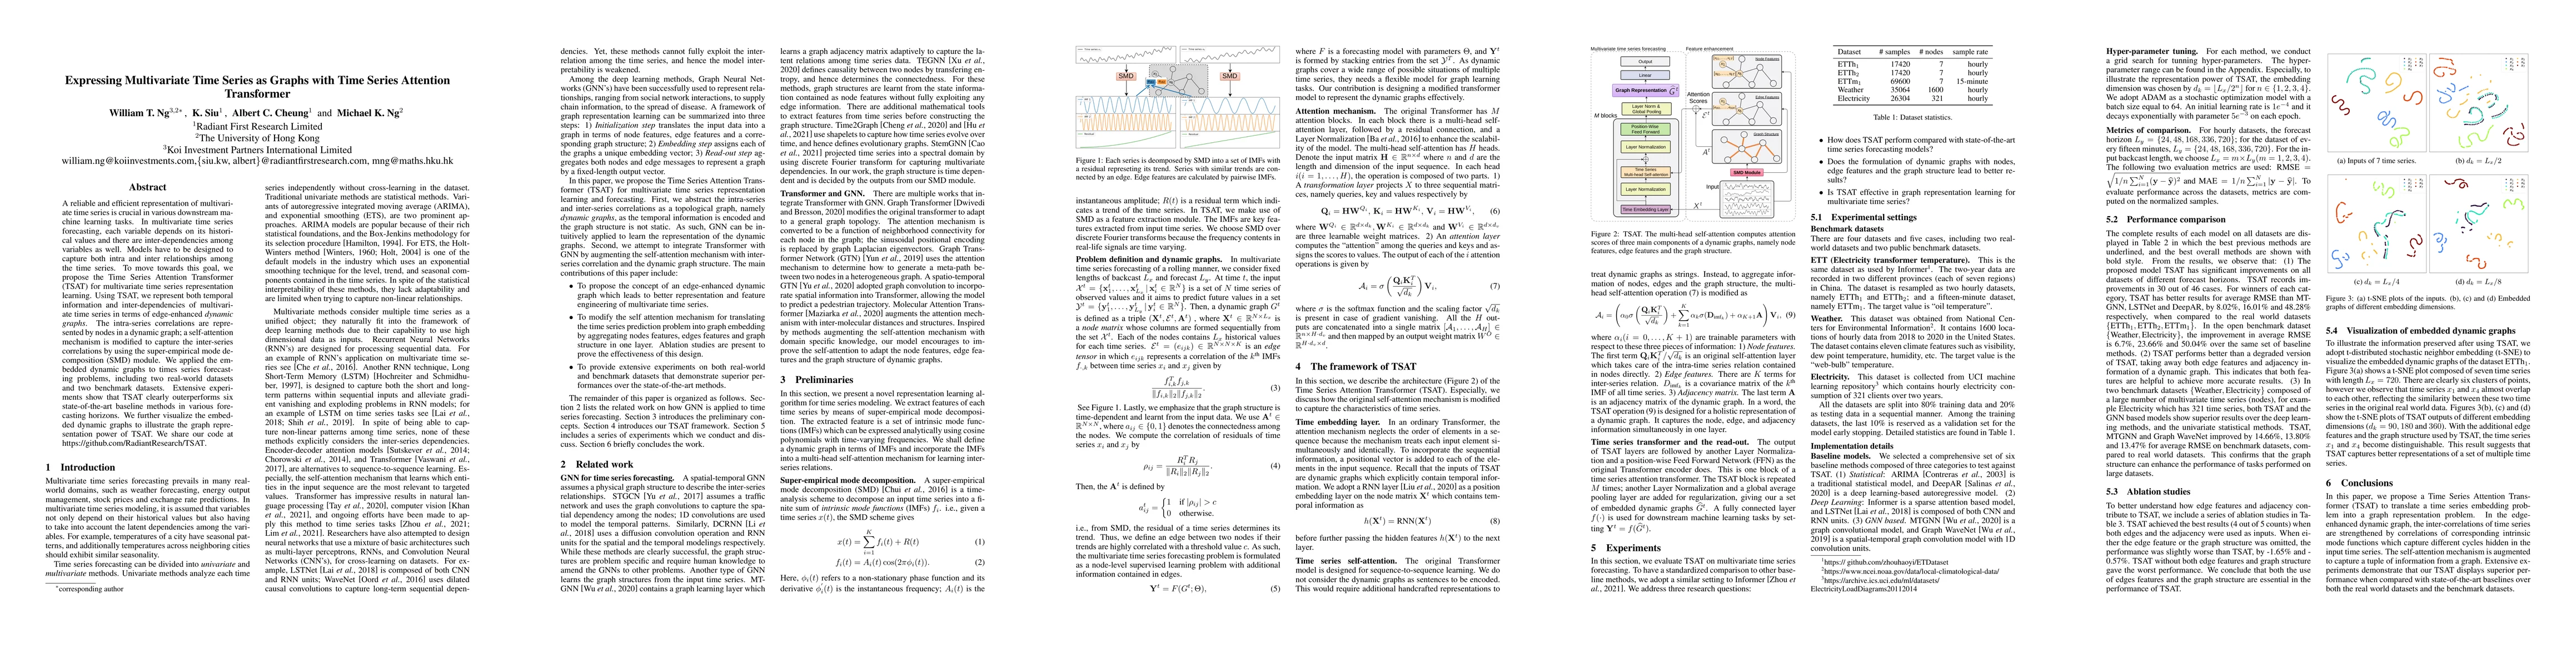
A reliable and efficient representation of multivariate time series is crucial in various downstream machine learning tasks. In multivariate time series forecasting, each variable depends on its historical values and there are inter-dependencies among variables as well. Models have to be designed to capture both intra- and inter-relationships among the time series. To move towards this goal, we propose the Time Series Attention Transformer (TSAT) for multivariate time series representation learning. Using TSAT, we represent both temporal information and inter-dependencies of multivariate time series in terms of edge-enhanced dynamic graphs. The intra-series correlations are represented by nodes in a dynamic graph; a self-attention mechanism is modified to capture the inter-series correlations by using the super-empirical mode decomposition (SMD) module. We applied the embedded dynamic graphs to times series forecasting problems, including two real-world datasets and two benchmark datasets. Extensive experiments show that TSAT clearly outerperforms six state-of-the-art baseline methods in various forecasting horizons. We further visualize the embedded dynamic graphs to illustrate the graph representation power of TSAT. We share our code at https://github.com/RadiantResearch/TSAT.
AI Key Findings
Get AI-generated insights about this paper's methodology, results, significance, and more — seven facets brought into focus.
Impact
Paper Details
Authors
PDF Preview
Key Terms
Citation Network
Current paper (gray), citations (green), references (blue)
Display is limited for performance on very large graphs.
Discussion 0