Publication
Metrics
AI Quick Summary
This paper explores a case study applying the Visual Analytics Framework to develop a new classification system for Colombia's National Administrative Department of Statistics (DANE). The study aims to enhance data visualization and comprehension, presenting insights from three main analysis tasks and proposed solutions.
Paper Preview
Abstract
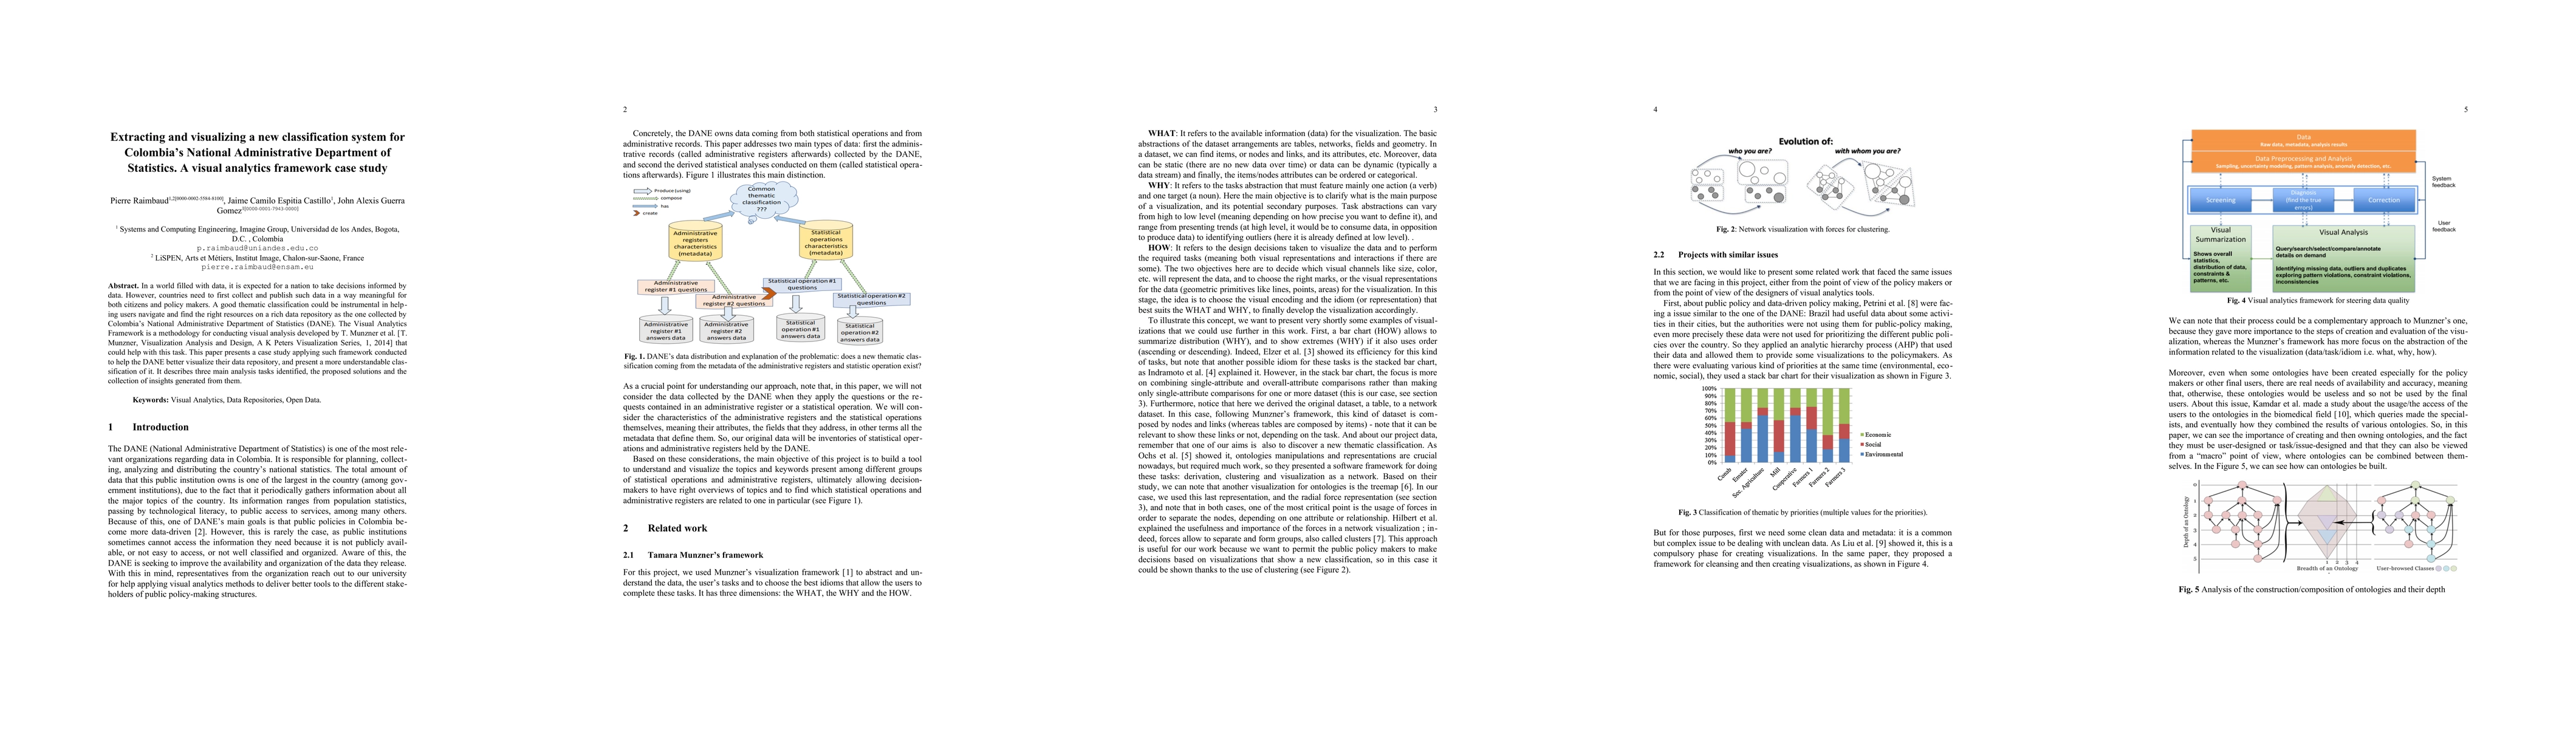
In a world filled with data, it is expected for a nation to take decisions informed by data. However, countries need to first collect and publish such data in a way meaningful for both citizens and policy makers. A good thematic classification could be instrumental in helping users navigate and find the right resources on a rich data repository as the one collected by Colombia's National Administrative Department of Statistics (DANE). The Visual Analytics Framework is a methodology for conducting visual analysis developed by T. Munzner et al. [T. Munzner, Visualization Analysis and Design, A K Peters Visualization Series, 1, 2014] that could help with this task. This paper presents a case study applying such framework conducted to help the DANE better visualize their data repository, and present a more understandable classification of it. It describes three main analysis tasks identified, the proposed solutions and the collection of insights generated from them.
AI Key Findings
Get AI-generated insights about this paper's methodology, results, significance, and more — seven facets brought into focus.
Impact
Paper Details
Authors
PDF Preview
Key Terms
Citation Network
Current paper (gray), citations (green), references (blue)
Display is limited for performance on very large graphs.
Discussion 0