Extremal points of Lorenz curves and applications to inequality analysis
Publication
Metrics
AI Quick Summary
This paper identifies extremal points of Lorenz curves with a fixed Gini index and computes the maximal $L^1$-distance between them. It introduces a bidimensional index for measuring relative inequality and dissimilarity between two populations, employing Gini indices and $L^1$-distances, and applies it to EU-SILC income datasets.
Paper Preview
Abstract
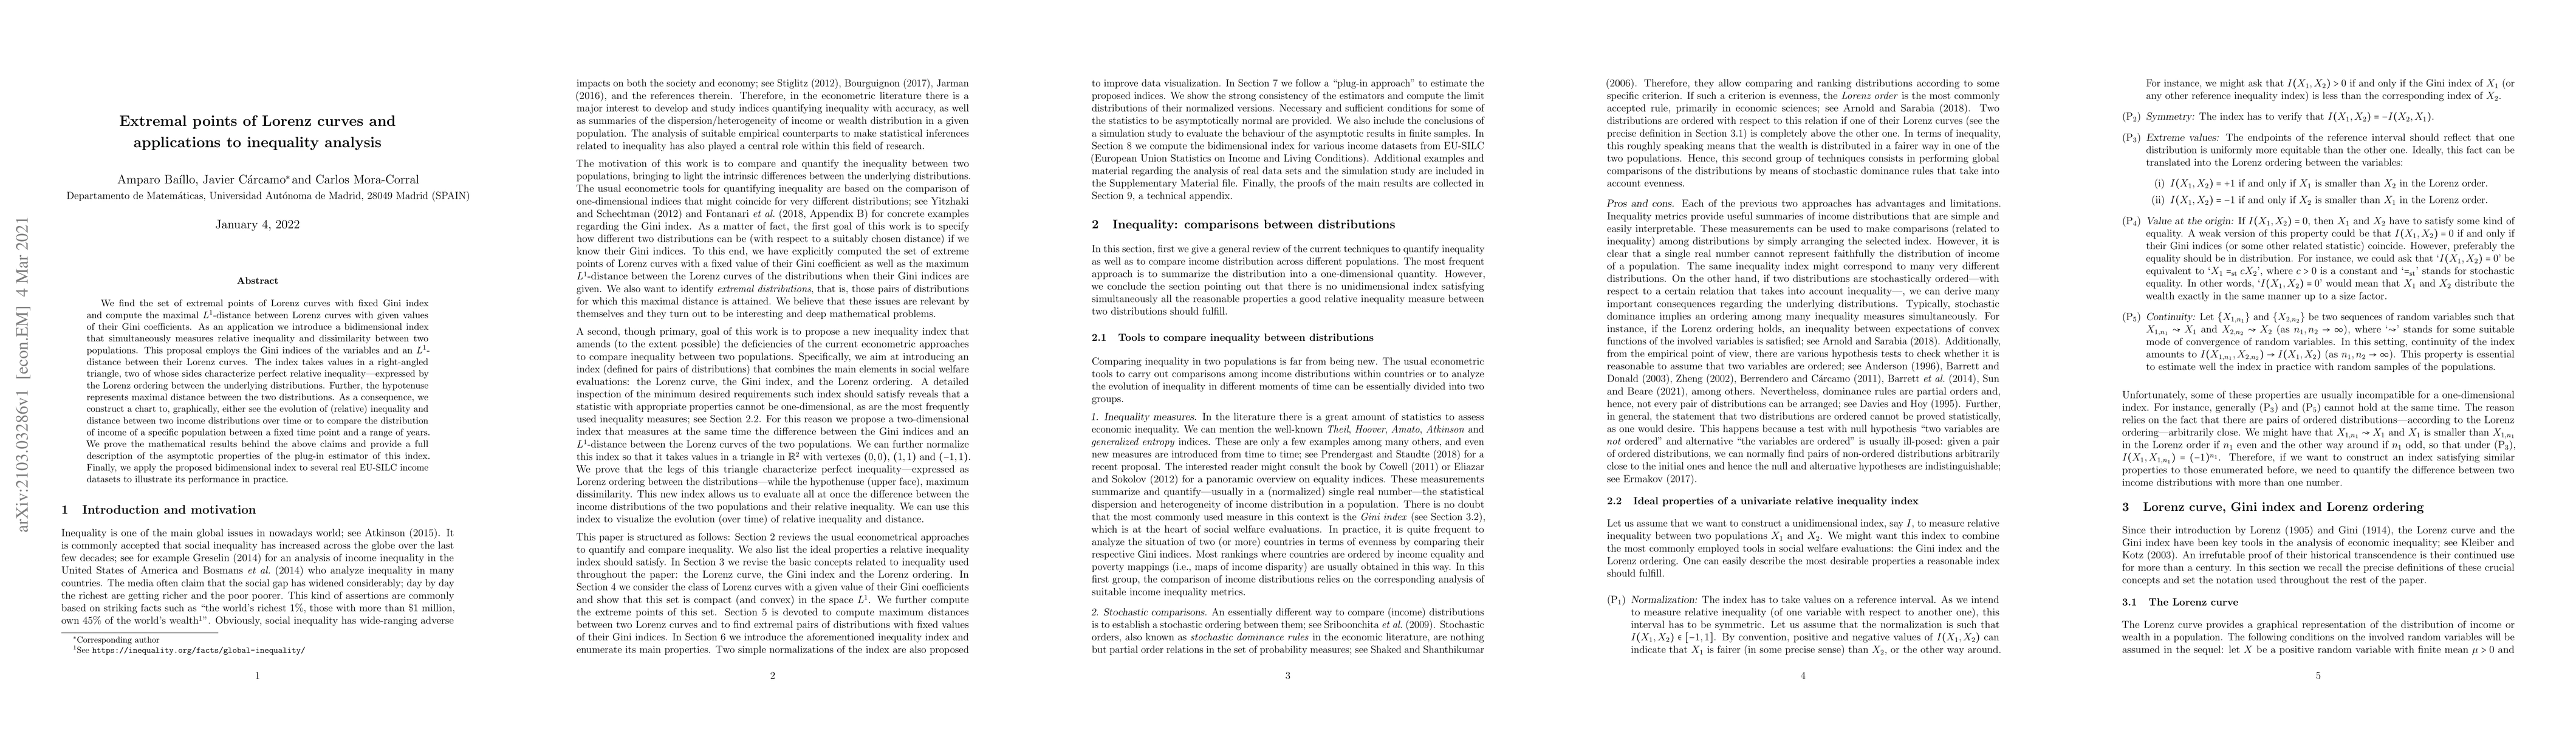
We find the set of extremal points of Lorenz curves with fixed Gini index and compute the maximal $L^1$-distance between Lorenz curves with given values of their Gini coefficients. As an application we introduce a bidimensional index that simultaneously measures relative inequality and dissimilarity between two populations. This proposal employs the Gini indices of the variables and an $L^1$-distance between their Lorenz curves. The index takes values in a right-angled triangle, two of whose sides characterize perfect relative inequality-expressed by the Lorenz ordering between the underlying distributions. Further, the hypotenuse represents maximal distance between the two distributions. As a consequence, we construct a chart to, graphically, either see the evolution of (relative) inequality and distance between two income distributions over time or to compare the distribution of income of a specific population between a fixed time point and a range of years. We prove the mathematical results behind the above claims and provide a full description of the asymptotic properties of the plug-in estimator of this index. Finally, we apply the proposed bidimensional index to several real EU-SILC income datasets to illustrate its performance in practice.
AI Key Findings
Get AI-generated insights about this paper's methodology, results, significance, and more — seven facets brought into focus.
Impact
Paper Details
Authors
PDF Preview
Key Terms
Citation Network
Current paper (gray), citations (green), references (blue)
Display is limited for performance on very large graphs.
Discussion 0