Publication
Metrics
AI Quick Summary
This study investigates the statistical characteristics of wave runup on a composite beach using direct numerical simulations based on nonlinear shallow water equations. The research highlights the effects of wave nonlinearity, wave breaking, and bandwidth on extreme runup heights, proposing the conditional Weibull distribution for modeling extreme inundations.
Paper Preview
Abstract
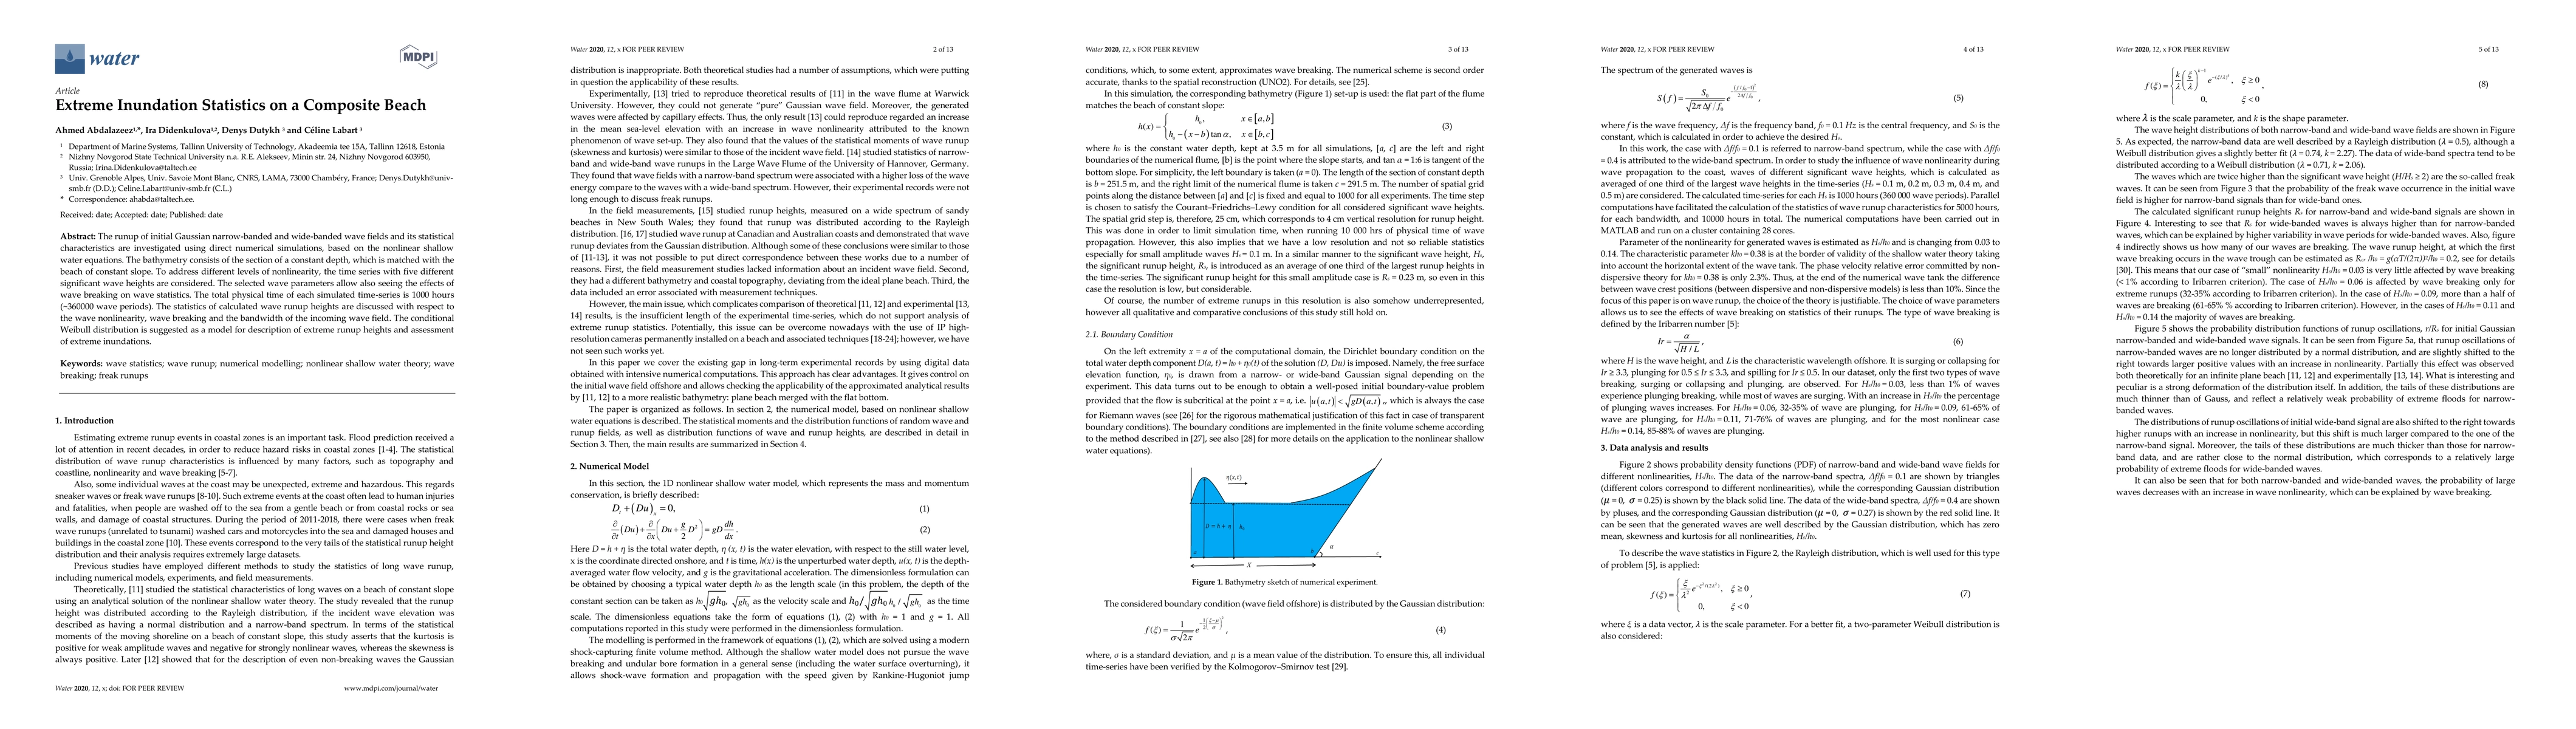
The runup of initial Gaussian narrow-banded and wide-banded wave fields and its statistical characteristics are investigated using direct numerical simulations, based on the nonlinear shallow water equations. The bathymetry consists of the section of a constant depth, which is matched with the beach of constant slope. To address different levels of nonlinearity, the time series with five different significant wave heights are considered. The selected wave parameters allow also seeing the effects of wave breaking on wave statistics. The total physical time of each simulated time-series is 1000 hours (~360000 wave periods). The statistics of calculated wave runup heights are discussed with respect to the wave nonlinearity, wave breaking and the bandwidth of the incoming wave field. The conditional Weibull distribution is suggested as a model for the description of extreme runup heights and assessment of extreme inundations.
AI Key Findings
Get AI-generated insights about this paper's methodology, results, significance, and more — seven facets brought into focus.
Impact
Paper Details
Authors
PDF Preview
Key Terms
Citation Network
Current paper (gray), citations (green), references (blue)
Display is limited for performance on very large graphs.
Discussion 0