Publication
Metrics
AI Quick Summary
This paper reviews extreme value statistics (EVS) for correlated random variables, comparing classical EVS for uncorrelated variables to the more complex scenarios involving strong correlations. It highlights the three main extreme value distributions and discusses renormalization techniques for weakly correlated variables. The paper also explores the challenges and limited analytical progress in understanding EVS for strongly correlated systems like Brownian motion and random matrix eigenvalues.
Paper Preview
Abstract
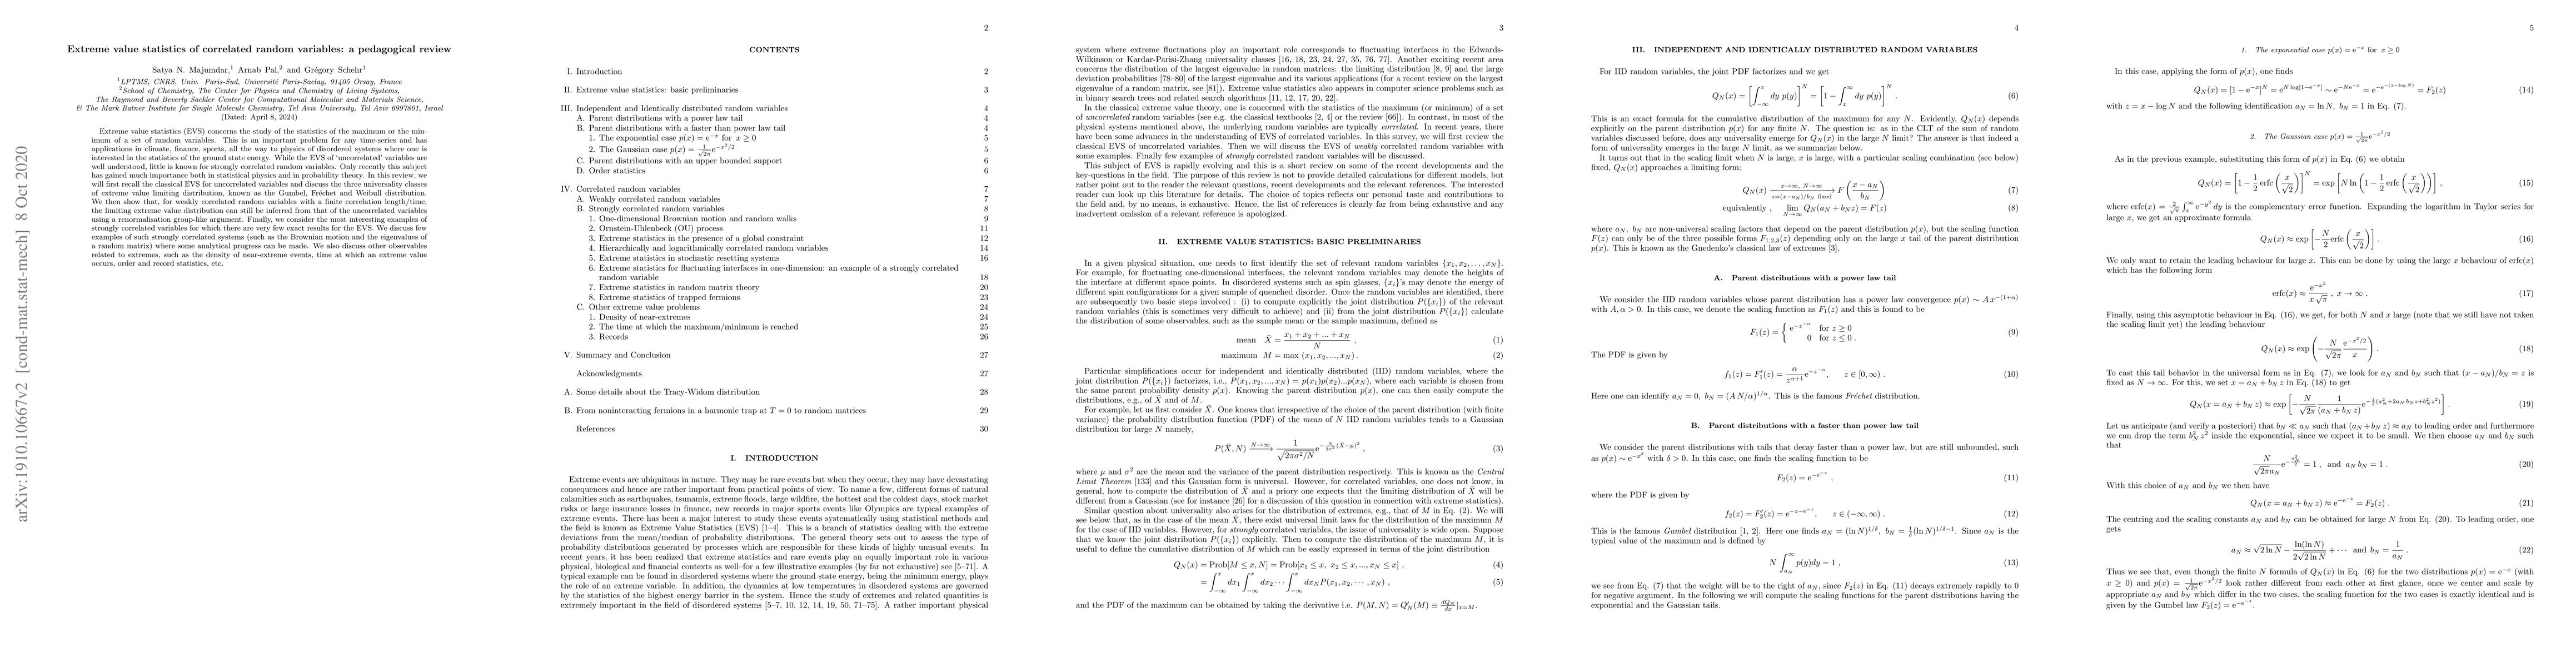
Extreme value statistics (EVS) concerns the study of the statistics of the maximum or the minimum of a set of random variables. This is an important problem for any time-series and has applications in climate, finance, sports, all the way to physics of disordered systems where one is interested in the statistics of the ground state energy. While the EVS of `uncorrelated' variables are well understood, little is known for strongly correlated random variables. Only recently this subject has gained much importance both in statistical physics and in probability theory. In this review, we will first recall the classical EVS for uncorrelated variables and discuss the three universality classes of extreme value limiting distribution, known as the Gumbel, Fr\'echet and Weibull distribution. We then show that, for weakly correlated random variables with a finite correlation length/time, the limiting extreme value distribution can still be inferred from that of the uncorrelated variables using a renormalisation group-like argument. Finally, we consider the most interesting examples of strongly correlated variables for which there are very few exact results for the EVS. We discuss few examples of such strongly correlated systems (such as the Brownian motion and the eigenvalues of a random matrix) where some analytical progress can be made. We also discuss other observables related to extremes, such as the density of near-extreme events, time at which an extreme value occurs, order and record statistics, etc.
AI Key Findings
Get AI-generated insights about this paper's methodology, results, significance, and more — seven facets brought into focus.
Impact
Paper Details
PDF Preview
Key Terms
Citation Network
Current paper (gray), citations (green), references (blue)
Display is limited for performance on very large graphs.
Discussion 0