$F_\beta$-plot -- a visual tool for evaluating imbalanced data classifiers
Publication
Metrics
AI Quick Summary
This paper introduces the $F_\beta$-plot, a visual tool to evaluate classifiers for imbalanced data. It addresses the lack of reliable metrics and ambiguity in existing aggregate metrics, providing a clear method to determine which classifier best meets user requirements based on the $F_\beta$ metric.
Paper Preview
Abstract
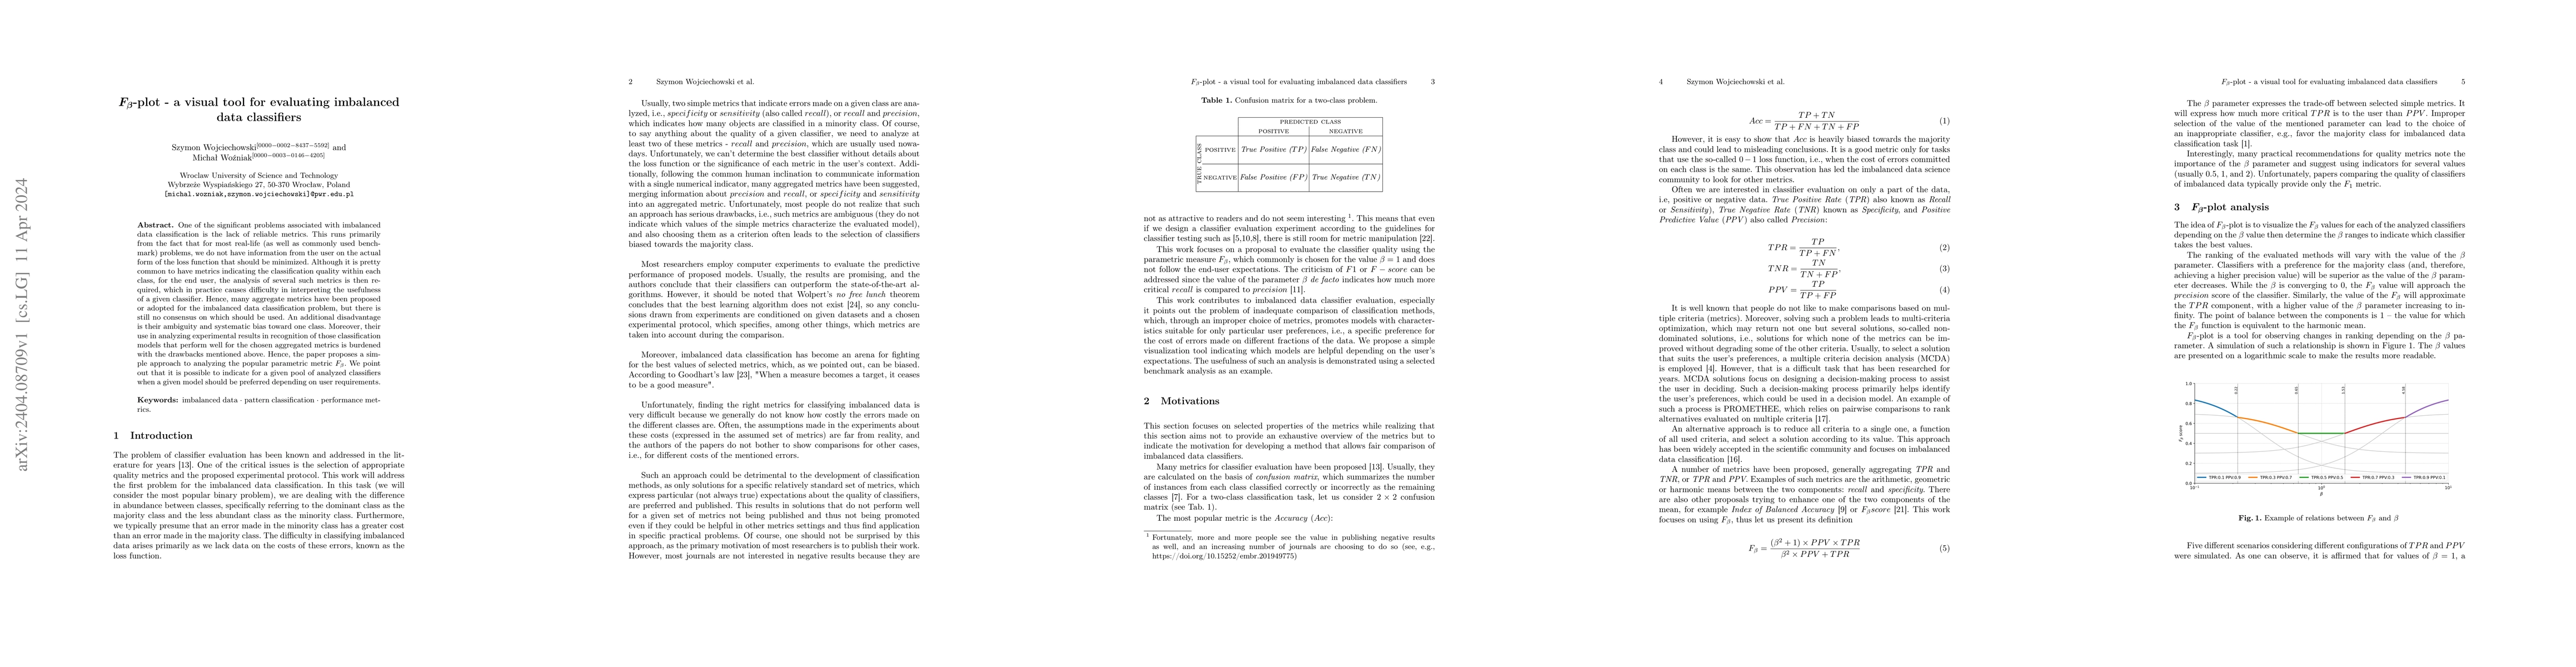
One of the significant problems associated with imbalanced data classification is the lack of reliable metrics. This runs primarily from the fact that for most real-life (as well as commonly used benchmark) problems, we do not have information from the user on the actual form of the loss function that should be minimized. Although it is pretty common to have metrics indicating the classification quality within each class, for the end user, the analysis of several such metrics is then required, which in practice causes difficulty in interpreting the usefulness of a given classifier. Hence, many aggregate metrics have been proposed or adopted for the imbalanced data classification problem, but there is still no consensus on which should be used. An additional disadvantage is their ambiguity and systematic bias toward one class. Moreover, their use in analyzing experimental results in recognition of those classification models that perform well for the chosen aggregated metrics is burdened with the drawbacks mentioned above. Hence, the paper proposes a simple approach to analyzing the popular parametric metric $F_\beta$. We point out that it is possible to indicate for a given pool of analyzed classifiers when a given model should be preferred depending on user requirements.
AI Key Findings
Get AI-generated insights about this paper's methodology, results, significance, and more — seven facets brought into focus.
Impact
Paper Details
Authors
PDF Preview
Key Terms
Citation Network
Current paper (gray), citations (green), references (blue)
Display is limited for performance on very large graphs.
Discussion 0