FALE: Fairness-Aware ALE Plots for Auditing Bias in Subgroups
Publication
Metrics
AI Quick Summary
This paper introduces FALE plots, an enhanced version of ALE plots designed for identifying and visualizing bias in subgroups within machine learning models. The proposed method aims to make fairness assessments more comprehensible for end users by measuring fairness changes corresponding to different feature values.
Paper Preview
Abstract
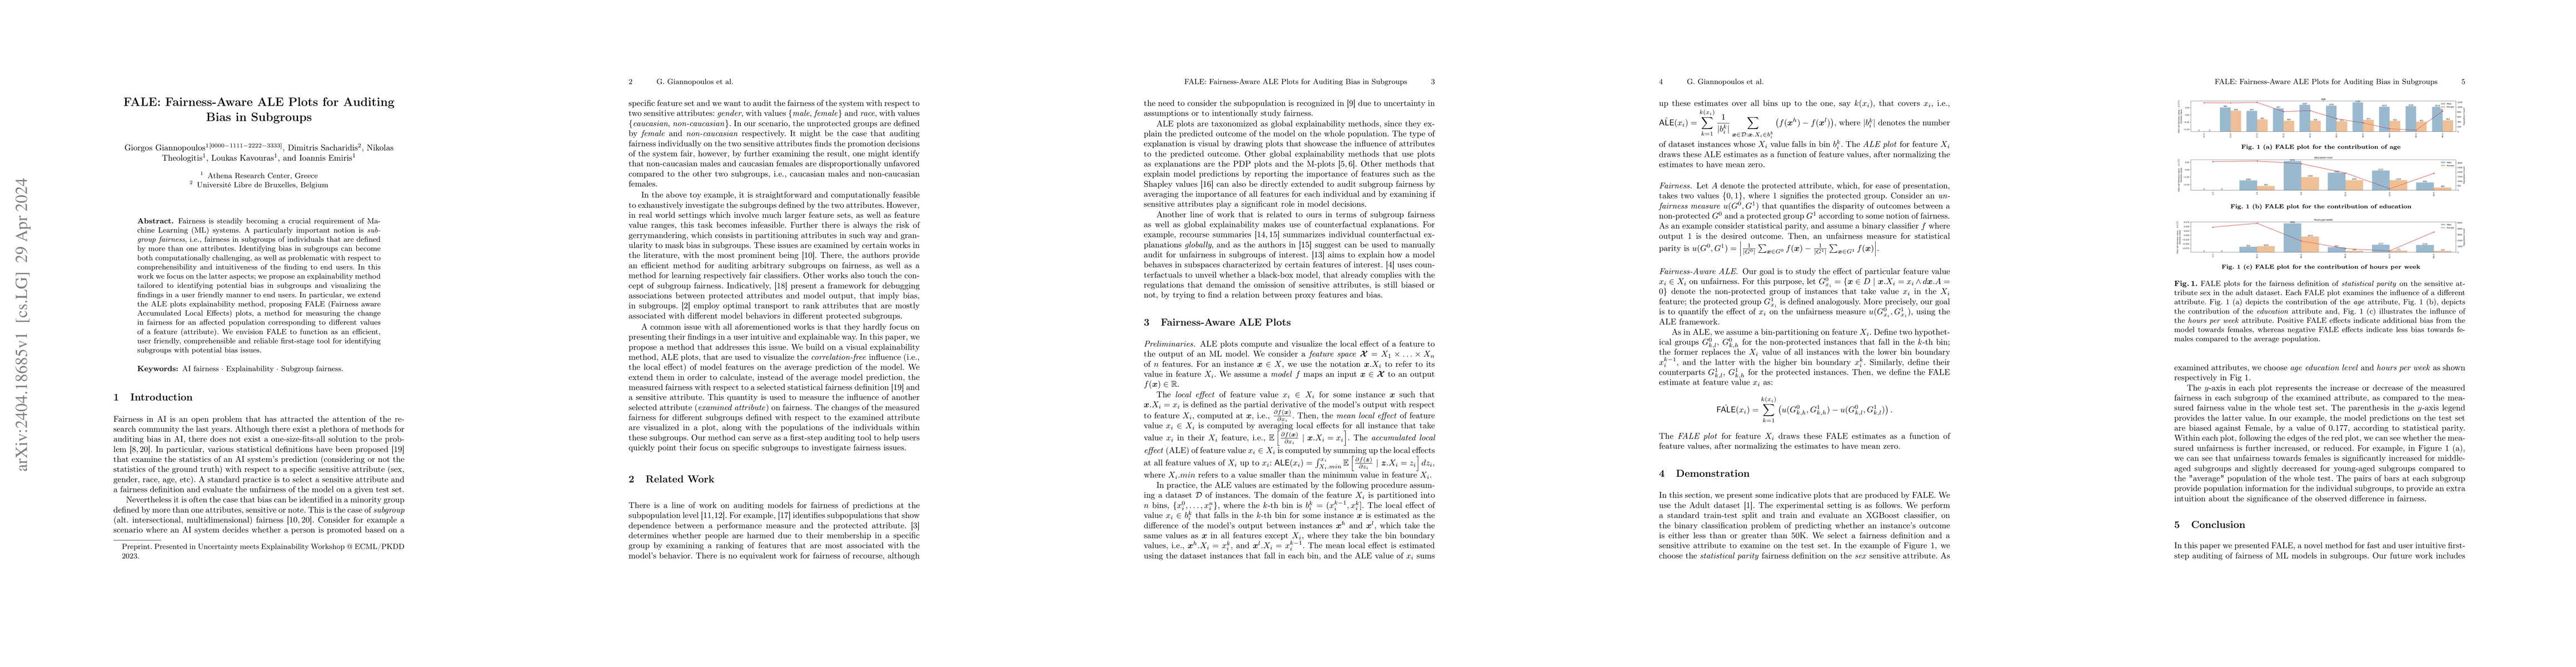
Fairness is steadily becoming a crucial requirement of Machine Learning (ML) systems. A particularly important notion is subgroup fairness, i.e., fairness in subgroups of individuals that are defined by more than one attributes. Identifying bias in subgroups can become both computationally challenging, as well as problematic with respect to comprehensibility and intuitiveness of the finding to end users. In this work we focus on the latter aspects; we propose an explainability method tailored to identifying potential bias in subgroups and visualizing the findings in a user friendly manner to end users. In particular, we extend the ALE plots explainability method, proposing FALE (Fairness aware Accumulated Local Effects) plots, a method for measuring the change in fairness for an affected population corresponding to different values of a feature (attribute). We envision FALE to function as an efficient, user friendly, comprehensible and reliable first-stage tool for identifying subgroups with potential bias issues.
AI Key Findings
Get AI-generated insights about this paper's methodology, results, significance, and more — seven facets brought into focus.
Impact
Paper Details
Authors
PDF Preview
Key Terms
Citation Network
Current paper (gray), citations (green), references (blue)
Display is limited for performance on very large graphs.
Discussion 0