Publication
Metrics
AI Quick Summary
Falx is a synthesis-powered visualization tool that simplifies creating visualizations by automatically inferring specifications and transforming data, even when there is a mismatch between data layout and design. A study with 33 data analysts found that Falx enables effective creation of visualizations that would otherwise require significant data transformation effort.
Paper Preview
Abstract
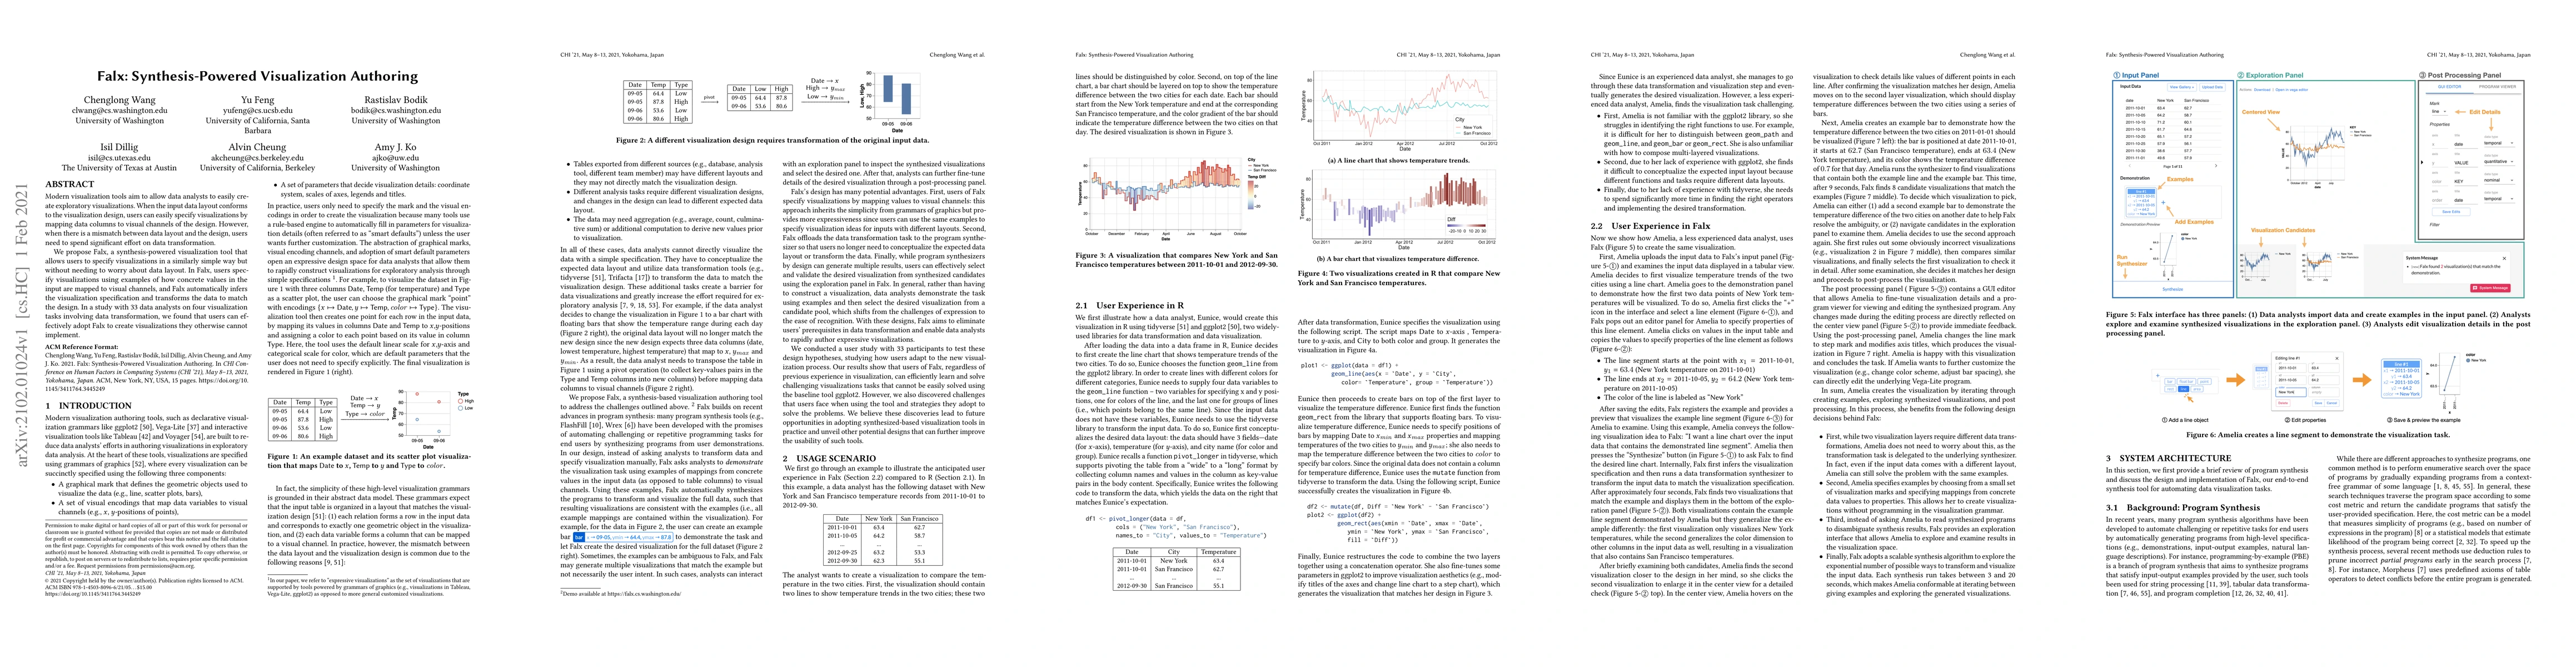
Modern visualization tools aim to allow data analysts to easily create exploratory visualizations. When the input data layout conforms to the visualization design, users can easily specify visualizations by mapping data columns to visual channels of the design. However, when there is a mismatch between data layout and the design, users need to spend significant effort on data transformation. We propose Falx, a synthesis-powered visualization tool that allows users to specify visualizations in a similarly simple way but without needing to worry about data layout. In Falx, users specify visualizations using examples of how concrete values in the input are mapped to visual channels, and Falx automatically infers the visualization specification and transforms the data to match the design. In a study with 33 data analysts on four visualization tasks involving data transformation, we found that users can effectively adopt Falx to create visualizations they otherwise cannot implement.
AI Key Findings
Get AI-generated insights about this paper's methodology, results, significance, and more — seven facets brought into focus.
Impact
Paper Details
Authors
PDF Preview
Key Terms
Citation Network
Current paper (gray), citations (green), references (blue)
Display is limited for performance on very large graphs.
Discussion 0